MATLAB: An Introduction with Applications
6th Edition
ISBN: 9781119256830
Author: Amos Gilat
Publisher: John Wiley & Sons Inc
expand_more
expand_more
format_list_bulleted
Question

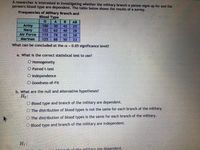
Transcribed Image Text:A researcher is interested in investigating whether the military branch a person slgns up for and the
person's blood type are dependent. The table below shows the results of a survey.
Frequencies of Military Branch and
Blood Type
A
B
AB
Army
Navy
Air Force
100
50
42
25
122
62
40
28
115
78
42
28
Marines
125
88
50
23
What can be concluded at the a 0.05 significance level?
a. What is the correct statistical test to use?
O Homogeneity
O Paired t-test
O Independence
O Goodness-of-Fit
b. What are the null and alternative hypotheses?
Но:
O Blood type and branch of the military are dependent.
O The distribution of blood types is not the same for each branch of the military.
O The distribution of blood types is the same for each branch of the military.
O Blood type and branch of the military are independent.
H1 :
Ttranch of the military are dependent.

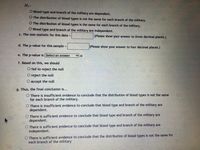
Transcribed Image Text:H1:
O Blood type and branch of the military are dependent.
O The distribution of blood types is not the same for each branch of the military.
O The distribution of blood types is the same for each branch of the military.
O Blood type and branch of the military are independent.
c. The test-statistic for this data =
(Please show your answer to three decimal places.)
d. The p-value for this sample
(Please show your answer to four decimal places.)
e. The p-value is Select an answer
f. Based on this, we should
O fail to reject the null
O reject the null
O accept the null
g. Thus, the final conclusion is...
O There is insufficient evidence to conclude that the distribution of blood types is not the same
for each branch of the military.
O There is insufficient evidence to conclude that blood type and branch of the military are
dependent.
O There is sufficient evidence to conclude that blood type and branch of the military are
dependent.
O There is sufficient evidence to conclude that blood type and branch of the military are
independent.
O There is sufficient evidence to conclude that the distribution of blood types is not the same for
each branch of the military
Expert Solution
This question has been solved!
Explore an expertly crafted, step-by-step solution for a thorough understanding of key concepts.
This is a popular solution
Trending nowThis is a popular solution!
Step by stepSolved in 3 steps with 2 images

Knowledge Booster
Learn more about
Need a deep-dive on the concept behind this application? Look no further. Learn more about this topic, statistics and related others by exploring similar questions and additional content below.Similar questions
- Does money buy happiness? This is an age-old question. A random sample of 1993 subjects were asked to rate their happiness (Not too happy, Pretty happy, or Very happy) and also report their level of income (Above average, average, below average). The table of the observations is presented below. Income Not too happy Pretty happy Very happy Total Above Average 26 233 164 423 Average 117 473 293 883 Below Average 172 383 132 687 Total 315 1089 589 1993arrow_forwardA researcher is interested in investigating whether the military branch a person signs up for and the person's blood type are dependent. The table below shows the results of a survey. Frequencies of Military Branch and Blood Type A AB Аrmy Navy 140 60 41 30 111 81 67 26 Air Force 124 51 46 21 Marines 118 88 67 27 What can be concluded at the a = 0.01 significance level? a. What is the correct statistical test to use? O Paired t-test O Goodness-of-Fit O Homogeneity O Independence b. What are the null and alternative hypotheses? H,: O Blood type and branch of the military are dependent. O The distribution of blood types is the same for each branch of the military. O Blood type and branch of the military are independent. O The distribution of blood types is not the same for each branch of the military. H : O The distribution of blood types is not the same for each branch of the military. O The distribution of blood types is the same for each branch of the military. O Blood type and branch…arrow_forwardBuckle up! - How does seat belt use vary with drivers' ethnic group? It is well known that location and gender (males are less likely to buckle up) are factors. Here is the data and the mosaic plot for a random sample of male drivers observed in Houston. Ethnic group of driver Belted Not Belted Total Black 277 99 376 Hispanic 373 164 537 White 197 62 259 Total 847 325 1172 Ethnicity Hispanic Black White Use of Seat Belt wearing a seat belt not wearing a seat beltarrow_forward
- Need help urgently pleasearrow_forwardPain medications sometimes come with side effects. One side effect is dizziness. A researcher wanted to determine if some pain medications produced more or less dizziness than others. The results from his study are shown in the table below. Use a test to determine if the proportion of people within each treatment group who experienced dizziness are the same at the � = .01 level of significance. Tordol Placebo Naproxen Tylenol Advil Dizziness 83 32 36 5 8 No dizziness 4063 1832 1330 382 337 1) Determine the null and alternative hypotheses. Select the correct pair. ��:The proportion of people within each treatment group who experienced dizziness are independent��: The proportion of people within each treatment group who experienced dizziness are dependent ��: The proportion of people within each treatment group who experienced dizziness are the same��: The proportion of people within each treatment group who experienced dizziness are different 2) Determine the…arrow_forwardI need help figuring out parts c and darrow_forward
- Need C and Darrow_forwardThe following table shows a sample dataset of observation values of an independent variable, Age, and a dependent variable, number of toys Age 5 3 6 3 4 4 6 8 Toys 13 15 7 12 13 11 9 5 What is the value of Toys when Age is 7 (round your answer without decimal)arrow_forwardA consumer magazine wants to compare lifetimes of ballpoint pens of three different types. The magazine takes a random sample of pens of each time and records the lifetimes (in minutes) in the table below. Do the data indicate that there is a difference in the mean lifetime for the three brands of ballpoint pens? Brand 1 Brand 2 Brand 3 260 181 238 218 240 257 184 162 241 219 218 213arrow_forward
- A research group is conducting an experiment to study the relationship between fitness levels and the number of hours spent exercising each week. Subjects are randomly selected and, after several fitness tests, are assigned a fitness score. The number of hours spent exercising per week is also recorded. Data for 15 subjects are given below. Subject Hours of Exercise per Week Fitness Score 1 1 3 2 1.5 4.7 3 1.75 6 4 2 5 5 2 6.5 6 4.5 14.2 7 2.5 13.5 8 3.25 15 9 3 13.4 10 3.75 14 11 3.5 10 12 4 10 13 2.5 12 14 5.25 14.5 15 5 15 Create a bar graph in Microsoft® Excel® using the data. Label the graph and include the source of the data. Construct an equation in two variables that models this relationship. This equation may be linear, polynomial, rational, square root, or variation? Is the equation an exact model or an approximate model of the relationship between the variables? Explain your reasoning. Use the equation to make a prediction of the likely value of the…arrow_forwardDoes the type of instruction in a college statistics class (either lecture or self-paced) influence students’ performance, as measured by the number of quizzes successfully completed during the semester? Twelve students were recruited for the study. Students received the lecture instruction or a self-paced instruction. The total number of quizzes completed during teach type of instruction appear below.arrow_forwardIs there an association between hair color and body type? The table below shows the results of a researcher's observations of randomly selected people. Frequencies of Hair Colors for Various Body Types Blonde Brunette Red Head 71 80 96 108 55 115 46 91 Short and Slender Short and Pudgy Tall and Slender Tall and Heavy What can be concluded at the o= 0.01 significance level? 53 74 69 63arrow_forward
arrow_back_ios
SEE MORE QUESTIONS
arrow_forward_ios
Recommended textbooks for you
 MATLAB: An Introduction with ApplicationsStatisticsISBN:9781119256830Author:Amos GilatPublisher:John Wiley & Sons Inc
 Probability and Statistics for Engineering and th...StatisticsISBN:9781305251809Author:Jay L. DevorePublisher:Cengage Learning
 Statistics for The Behavioral Sciences (MindTap C...StatisticsISBN:9781305504912Author:Frederick J Gravetter, Larry B. WallnauPublisher:Cengage Learning
 Elementary Statistics: Picturing the World (7th E...StatisticsISBN:9780134683416Author:Ron Larson, Betsy FarberPublisher:PEARSON
 The Basic Practice of StatisticsStatisticsISBN:9781319042578Author:David S. Moore, William I. Notz, Michael A. FlignerPublisher:W. H. Freeman
 Introduction to the Practice of StatisticsStatisticsISBN:9781319013387Author:David S. Moore, George P. McCabe, Bruce A. CraigPublisher:W. H. Freeman

MATLAB: An Introduction with Applications
Statistics
ISBN:9781119256830
Author:Amos Gilat
Publisher:John Wiley & Sons Inc

Probability and Statistics for Engineering and th...
Statistics
ISBN:9781305251809
Author:Jay L. Devore
Publisher:Cengage Learning

Statistics for The Behavioral Sciences (MindTap C...
Statistics
ISBN:9781305504912
Author:Frederick J Gravetter, Larry B. Wallnau
Publisher:Cengage Learning

Elementary Statistics: Picturing the World (7th E...
Statistics
ISBN:9780134683416
Author:Ron Larson, Betsy Farber
Publisher:PEARSON

The Basic Practice of Statistics
Statistics
ISBN:9781319042578
Author:David S. Moore, William I. Notz, Michael A. Fligner
Publisher:W. H. Freeman

Introduction to the Practice of Statistics
Statistics
ISBN:9781319013387
Author:David S. Moore, George P. McCabe, Bruce A. Craig
Publisher:W. H. Freeman