
MATLAB: An Introduction with Applications
6th Edition
ISBN: 9781119256830
Author: Amos Gilat
Publisher: John Wiley & Sons Inc
expand_more
expand_more
format_list_bulleted
Related questions
Question

Transcribed Image Text:K
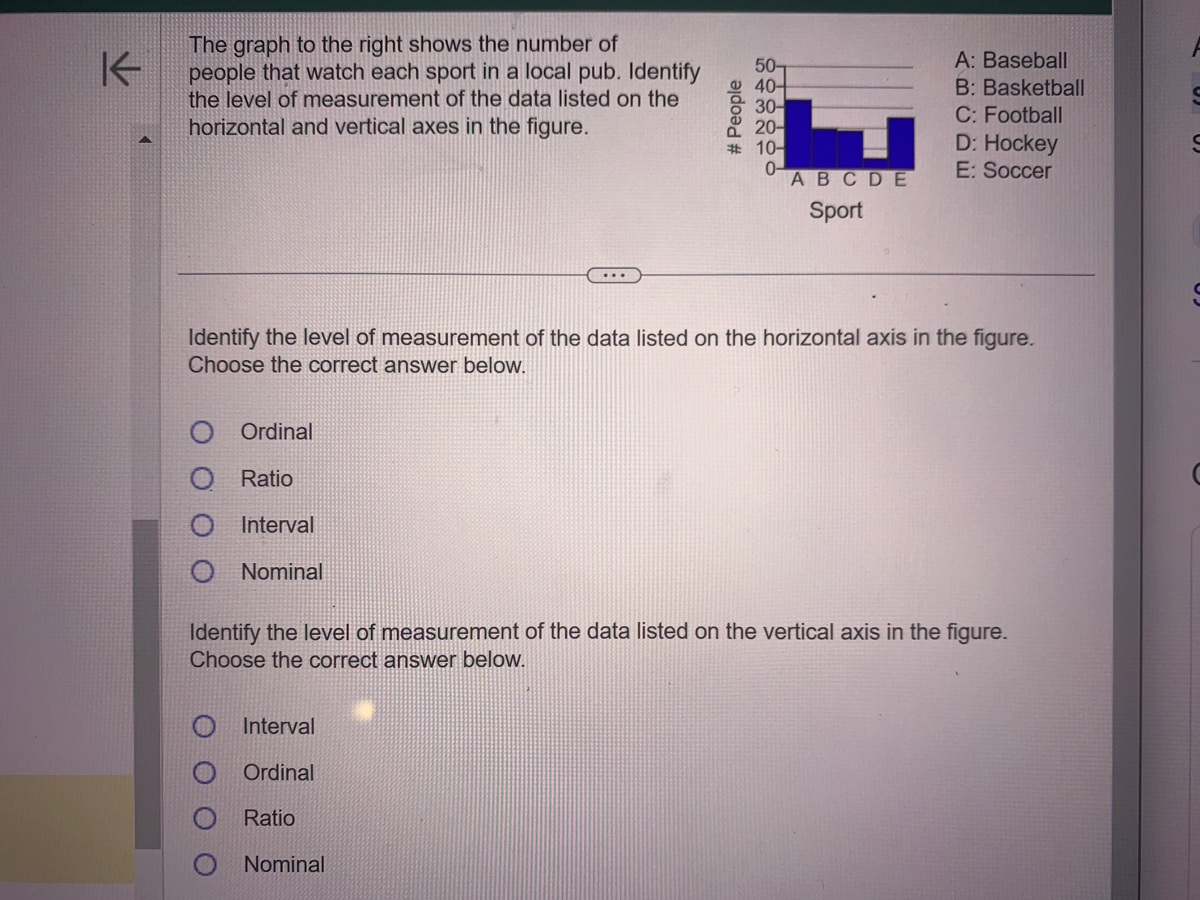
The graph to the right shows the number of
people that watch each sport in a local pub. Identify
the level of measurement of the data listed on the
horizontal and vertical axes in the figure.
Ordinal
Ratio
Interval
Nominal
50-
40-
30-
20-
# 10-
0-
Interval
Ordinal
# People
O Ratio
O Nominal
ABCDE
Sport
Identify the level of measurement of the data listed on the horizontal axis in the figure.
Choose the correct answer below.
A: Baseball
B: Basketball
C: Football
D: Hockey
E: Soccer
Identify the level of measurement of the data listed on the vertical axis in the figure.
Choose the correct answer below.
Expert Solution
This question has been solved!
Explore an expertly crafted, step-by-step solution for a thorough understanding of key concepts.

This is a popular solution

Trending nowThis is a popular solution!

Step by stepSolved in 4 steps

Knowledge Booster

Similar questions
- help me please.arrow_forwardA group of school parents are asked how many children they have. Number of children Frequency 1 25 21 18 9. Which graph(s) would be appropriate for this data set? Select all that apply. histogram pie chart bar graph dot plotarrow_forwardThe prices vary depending on the condition of the radio. $210, $210, $320, $200, $300, $10, $340, $300, $245, $325, $700, $250, $240, $200 a. Find the mean of the radio prices. Round to the nearest cent.arrow_forward
- Please do not give solution in image format thanku A car salesman collected data on how many cars were sold at a dealership per day for two weeks. The results were as follows: 6, 7, 4, 3, 1, 2, 6, 6, 6, 7, 4, 4. Make a frequency table and then make a histogram based on that frequency table. What is the shape of the distribution? O Skewed to the right O Skewed to the left O Bimodal O Symmetricalarrow_forwardd-Whisker Plots HOTSPOT LABEL Find the range and interquartile range (IQR) for the monthly rainfall (in millime- ters) in Seattle based on the box-and-whisker plot below. Average Monthly Rainfall in Seattle (millimeters) in | bartleby - G... 20 80 140 +++ 200 . Press each hotspot. Label the corresponding number below with the requested value. All Charges Пarrow_forwardPlease do not give solution in image format thankuarrow_forward
- Arm circumferences of 122 outpatients at a clinic in Santa Cruz are measured in centimeters. The resulting data are ... O Numerical and continuous. O Numerical and discrete. O Categorical and ordinal. O Categorical and nominal.arrow_forwardDraw a pictograph to represent the data displayed in the table below. Choose whatever symbol you like and be sure to include a key with the scale that you used. Subject Number of Students Math 16 Science 8. English 12 History 8. Art 4 Subject Number of Students Math Science English History Art Key:arrow_forwardWhat are the relative frequenciesarrow_forward
- Can you answer ONLY 28 G and H thanks i only need G AND Harrow_forwardes The box plot shows the undergraduate in-state tuition per credit hour at four-year public colleges. 1,500 1,200 900 600 300 0 a. Estimate the median. Medianarrow_forwardConsider the woman's 100 Your - and the subsequent 100 meter - in the Olympics since records have been kept determined the best way to combine all the data in depict the data would you use a histogram A-line graph a stem and leaf plot or a scatterplotarrow_forward
arrow_back_ios
SEE MORE QUESTIONS
arrow_forward_ios
Recommended textbooks for you
- MATLAB: An Introduction with ApplicationsStatisticsISBN:9781119256830Author:Amos GilatPublisher:John Wiley & Sons Inc
 Probability and Statistics for Engineering and th...StatisticsISBN:9781305251809Author:Jay L. DevorePublisher:Cengage Learning
 Statistics for The Behavioral Sciences (MindTap C...StatisticsISBN:9781305504912Author:Frederick J Gravetter, Larry B. WallnauPublisher:Cengage Learning
  Elementary Statistics: Picturing the World (7th E...StatisticsISBN:9780134683416Author:Ron Larson, Betsy FarberPublisher:PEARSON
 The Basic Practice of StatisticsStatisticsISBN:9781319042578Author:David S. Moore, William I. Notz, Michael A. FlignerPublisher:W. H. Freeman
 Introduction to the Practice of StatisticsStatisticsISBN:9781319013387Author:David S. Moore, George P. McCabe, Bruce A. CraigPublisher:W. H. Freeman
MATLAB: An Introduction with Applications
Statistics
ISBN:9781119256830
Author:Amos Gilat
Publisher:John Wiley & Sons Inc
Probability and Statistics for Engineering and th...
Statistics
ISBN:9781305251809
Author:Jay L. Devore
Publisher:Cengage Learning
Statistics for The Behavioral Sciences (MindTap C...
Statistics
ISBN:9781305504912
Author:Frederick J Gravetter, Larry B. Wallnau
Publisher:Cengage Learning
Elementary Statistics: Picturing the World (7th E...
Statistics
ISBN:9780134683416
Author:Ron Larson, Betsy Farber
Publisher:PEARSON
The Basic Practice of Statistics
Statistics
ISBN:9781319042578
Author:David S. Moore, William I. Notz, Michael A. Fligner
Publisher:W. H. Freeman
Introduction to the Practice of Statistics
Statistics
ISBN:9781319013387
Author:David S. Moore, George P. McCabe, Bruce A. Craig
Publisher:W. H. Freeman