Practical Management Science
6th Edition
ISBN: 9781337406659
Author: WINSTON, Wayne L.
Publisher: Cengage,
expand_more
expand_more
format_list_bulleted
Question
Ch.6 Q 7

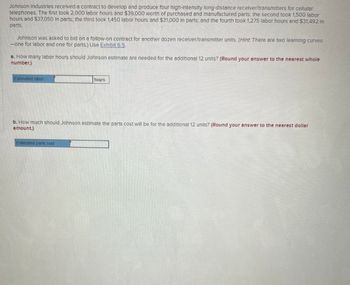
Transcribed Image Text:Johnson Industries received a contract to develop and produce four high-Intensity long-distance recelver/transmitters for cellular
telephones. The first took 2,000 labor hours and $39,000 worth of purchased and manufactured parts; the second took 1,500 labor
hours and $37,050 in parts; the third took 1,450 labor hours and $31,000 In parts; and the fourth took 1,275 labor hours and $31,492 In
parts.
Johnson was asked to bid on a follow-on contract for another dozen receiver/transmitter units. (Hint. There are two learning curves
-one for labor and one for parts.) Use Exhibit 6.5.
a. How many labor hours should Johnson estimate are needed for the additional 12 units? (Round your answer to the nearest whole
number.)
Estimated labor
hours
b. How much should Johnson estimate the parts cost will be for the additional 12 units? (Round your answer to the nearest dollar
amount.)
Estimated parts cost

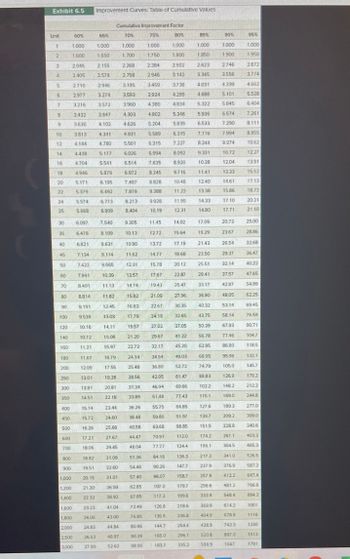
Transcribed Image Text:Exhibit 6.5
Unit
1
2
3
4
5
6
7
8
9
10
12
14
16
18
20
22
24
25
30
35
40
45
50
60
70
80
90
100
120
140
160
180
200
250
300
350
400
450
500
600
700
800
900
60%
1.000
1.600
1,000
1,200
1,400
1,600
1,800
2045
2.405
2.210
2.977
3.216
3.432
3.630
3813
4.144
4438
4.704
4.946
5.171
5.379
2,000
2.500
3,000
5.574
5.668
6.097
6.478
6.821
7.134
7.422
7,941
8401
8.814
9.191
9.539
10.16
10.72
11.21
11.67
12.09
13.01
13.81
14.51
15.14
15.72
16.26
17.21
18.06
18.82
19.51
Improvement Curves: Table of Cumulative Values
65%
1.000
1.650
2.155
2.578
2946
3.274
3.572
3.847
4.102
4.341
4.780
5.177
5.541
5.879
6.195
6.492
6.773
6.909
7.540
8.109
8.631
9.114
9.565
10.39
11.13
11.82
12.45
13.03
14.11
15.06
15.97
Cumulativo Improvement Factor
70%
75%
80%
1.000
1.000
1.700
1.750
2.268
2.758
3.195
3.593
3.960
4.380
4.303 4.802
4.626
5.204
5.589
6315
6.994
7.635
8.245
8.828
9.388
9928
10.19
16.79
17.55
19.28
20.81
22.18
23.44
24.60
25.68
27.67
29.45
20.15
21.30 36.59
22.32
38.92
4.931
5501
23.23
41.04
24.06
43.00
24.83 44.84
26.53 48.97
27.99
52.62
6.026
6.514
6.972
7.407
7.819
8.213
8.404
25.48
28.56
31.34
33.89
36.26
38.48
40.58
44.47
48.04
31.09 51.36
32.60
54.46
31.01
57.40
9.305 11.45
10.13
10.90
11.62
12.31
13.57
14.74
24.14
15.82
1683 22.67
17.79
24.18
19.57
21.20
22.72
62.85
67.85
72.49
2.384
2946
3459
3.934
76.85
80.96
90.39
98.90
1272
13.72
1477
15.78
17.67
19.43
21.09
27.02
29.67
32.17
34.54
36.80
42.05
46.94
51.48
55.75
59.80
63.68
70.97
77.27
84.18
90.26
96.07
107.0
117.2
126.8
135.9
144.7
165.0
1837
85%
1.000
1.850
2502
2.623
3.142
3.345
3738
4.031
4.299
4.688
4.834
5.322
5.346 5.936 6.574
5.839
6.533
7.290
1.000
1.800
6.315
7.116
7,227 8.244
8.092
9.331
8.920
10.38
9.716
11.41
10.48
11.23
11.95
12.31
14.02
15.64
17.19
18.68
20.12
22.87
25.47
27.96
30.35
32.65
37.05
41 22
45.20
49.03
52.72
61.47
69.66
77.43
84.85
91.97
98.85
112.0
124.4
136.3
147.7
158.7
179.7
199.6
218.6
236.8
254.4
296.1
335.2
12.40
13.38
14.33
14.80
36.80
40.32
43.75
50.39
56.78
62.95
68.95
74.79
88.83
102.2
115.1
127.6
139.7
151.5
174.2
196.1
217.3
237.9
257.9
296.6
333.9
369.9
90%
1.000
1900
17.09
19.29
21.43 26.54
23.50
29.37
25.51
32.14
29.41
37.57
33.17
42.87
48.05
53.14
58.14
67.93
4049
438.9
520.8
598.9
2746
3.556
4.339
5.101
5.845
7.994
9.374
10.72
12.04
13.33
14.61
15.86
17.10
17.71
20.73
23.67
77.46
86.80
95.96
105.0
126.9
148.2
169.0
189.3
209.2
228.8
267.1
304.5
341.0
95%
1.000
1.950
614.2
678.8
7423
897.0
1047
2.872
3.774
4.662
5.538
6.404
132.1
145.7
179.2
212.2
244.8
277.0
309.0
340.6
403.3
465.3
526.5
376.9
587.2
4122 647.4
481.2
766.6
548.4
7.261
8.111
8.955
10.62
12:27
13.91
15.52
17.13
18.72
20.31
21.10
25.00
28.86
32.68
36.47
40.22
47.65
54.99
62.25
69.45
76.59
90.71
104.7
118.5
884.2
1001
1116
1230
1513
1791
Expert Solution
arrow_forward
Step 1
Given,
First unit took T1 = 2000 hours
Purchased $39000 worth
Second unit took T2 = 1500 hours
Purchased $37050 worth
Third unit took T3 = 1450 hours
Purchased $31000 worth
Third unit took T3 = 1275 hours
Purchased $31492 worth
Trending nowThis is a popular solution!
Step by stepSolved in 2 steps

Knowledge Booster
Similar questions
- Question 4 There are many types of airlines involved in the air cargo business. Think of an airline that you are familiar with. Determine the characteristics of this airline (e.g. aircraft fleet, services provided, products, service quality and service coverage) and its classification by the air cargo business. (10 marks) With reference to the same airline, critique on three (3) key challenges the airline is likely to face in terms of managing its revenue. (15 marks) (a) (b)arrow_forwardQuestion 1: A piece of equipment used in a business has a basis of $25,000 and is expected to have salvage value $5,000 at the end of it's 5 years of useful life. Find its annual depreciation rate and tabulate the annual depreciation amounts and book value of the equipment at the end of each year. Nearsarrow_forwardQw.35.arrow_forward
- Question 47 Different levels of supply chain analytics include Descriptive, Predictive, Prescriptive, and Cognitive analysis. ents O True O False Question 48 Course ACE) Integrated carriers provide door-to-door service, a consistent schedule of pickup and delivery windows, and standard expedited service through their hub-and-spoke networks. Nonintegrated carriers provide on-demand, air-only service from airport to airport. They rely on freight forwarders or the customer to provide delivery service to and from the airport True O Falsearrow_forwardQuestion 17 If both potential injurers and potential victims are fully insured, which condition is necessary to produce an efficient level of precautionary effort by both parties? competition between insurers to drive insurance prices down to the expected cost of accidents plus administrative costs O a strict liability rule O punitive damages to discourage reckless behavior O a comparative negligence rule to allocate the damages between the victim and the injurerarrow_forwardQuestion#3 In JUnit the principle of “Hollywood Principle: Don’t call us, we’ll call you” is commonly known as _____________ a) Calling Principle b) Control Call c) Inversion of Control d) No-Show Principlearrow_forward
- Question 9 Listen You have a bag of 10 marbles. Two marbles are red, three marbles are white, and five marbles are black. Using the multiplication rule for dependent and in- dependent events, what are the probabilities for the following events? **HINT** Order matters With replacement n' Without replacement n! (n-r)! Order doesn't matter (+)- (n+r-1)! (n-1)!! (c)-- 111(115) Draw two red marbles without replacement. Draw a red marble and then a black marble without replacement. Draw a white marble and then a black marble with replacement. Draw two black marbles with replacement. a. b. 45 C. 3 20 d. 4arrow_forwardCh.6 Q5arrow_forwardQuestion 54 It is possible for companies to use some combination of push and pull strategy. O True O Falsearrow_forward
- Compensatory damages compensates a Plaintiff for injuries suffered, such as medical expenses and loss of consortium. Question 12 options: TRUE FALSE None of the above All of the abovearrow_forwardQuestion 3 (1 point) ✓ Saved Which of these items product? (not a service) Haircut Dry cleaning Cell phone Mowing Question 4 (1 point) A Saved is responsible for all debt and is easy to rarrow_forwardCh. 12 Q9arrow_forward
arrow_back_ios
SEE MORE QUESTIONS
arrow_forward_ios
Recommended textbooks for you
 Practical Management ScienceOperations ManagementISBN:9781337406659Author:WINSTON, Wayne L.Publisher:Cengage,
 Operations ManagementOperations ManagementISBN:9781259667473Author:William J StevensonPublisher:McGraw-Hill Education
 Operations and Supply Chain Management (Mcgraw-hi...Operations ManagementISBN:9781259666100Author:F. Robert Jacobs, Richard B ChasePublisher:McGraw-Hill Education
 Purchasing and Supply Chain ManagementOperations ManagementISBN:9781285869681Author:Robert M. Monczka, Robert B. Handfield, Larry C. Giunipero, James L. PattersonPublisher:Cengage Learning
 Production and Operations Analysis, Seventh Editi...Operations ManagementISBN:9781478623069Author:Steven Nahmias, Tava Lennon OlsenPublisher:Waveland Press, Inc.

Practical Management Science
Operations Management
ISBN:9781337406659
Author:WINSTON, Wayne L.
Publisher:Cengage,

Operations Management
Operations Management
ISBN:9781259667473
Author:William J Stevenson
Publisher:McGraw-Hill Education

Operations and Supply Chain Management (Mcgraw-hi...
Operations Management
ISBN:9781259666100
Author:F. Robert Jacobs, Richard B Chase
Publisher:McGraw-Hill Education


Purchasing and Supply Chain Management
Operations Management
ISBN:9781285869681
Author:Robert M. Monczka, Robert B. Handfield, Larry C. Giunipero, James L. Patterson
Publisher:Cengage Learning

Production and Operations Analysis, Seventh Editi...
Operations Management
ISBN:9781478623069
Author:Steven Nahmias, Tava Lennon Olsen
Publisher:Waveland Press, Inc.