MATLAB: An Introduction with Applications
6th Edition
ISBN: 9781119256830
Author: Amos Gilat
Publisher: John Wiley & Sons Inc
expand_more
expand_more
format_list_bulleted
Topic Video
Question

Transcribed Image Text:Fignment
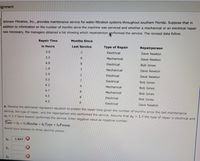
Johnson Filtration, Inc., provides maintenance service for water-filtration systems throughout southern Florida. Suppose that in
addition to information on the number of months since the machine was serviced and whether a mechanical or an electrical repair
was necessary, the managers obtained a list showing which repairperson rerformed the service. The revised data follow.
Repair Time
Months Since
in Hours
Last Service
Type of Repair
Repairperson
3.0
2
Electrical
Dave Newton
3.0
Mechanical
Dave Newton
4.8
8.
Electrical
Bob Jones
1.9
3
Mechanical
Dave Newton
2.9
Electrical
Dave Newton
5.0
Electrical
Bob Jones
4.2
6.
Mechanical
Bob Jones
4.7
8.
Mechanical
Bob Jones
4.5
4
Electrical
Bob Jones
4.5
6.
Electrical
Dave Newton
a. Develop the estimated regression equation to predict the repair time given the number of months since the last maintenance
service, the type of repair, and the repairperson who performed the service. Assume that I2 = 1 if the type of repair is electrical and
I3 1 if Dave Newton performed the service. Enter negative value as negative number.
Time = bo + biMonths + b2 Type + b3Person
%3D
Round your answers to three decimal places.
bo
1.847
b2

Transcribed Image Text:%3D
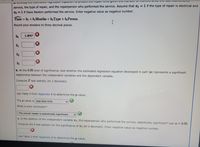
service, the type of repair, and the repairperson who performed the service. Assume that 22 = 1 if the type of repair is electrical and
I3 = 1 if Dave Newton performed the service. Enter negative value as negative number.
Time = bo +b Months + b2 Type + b3Person
Round your answers to three decimal places.
bo
1.847
by
b3
b. At the 0.05 level of significance, test whether the estimated regression equation developed in part (a) represents a significant
relationship between the independent variables and the dependent variable.
Compute F test statistic (to 2 decimals).
Use Table 4 from Appendix B to determine the p-value.
The p-value is less than 0.01
What is your conclusion?
The overall model is statistically significant
c. Is the addition of the independent variable 13, the repairperson who performed the service, statistically significant? Use a = 0.05.
%3D
Compute thet test statistic for the significance of 3 (to 2 decimals). Enter negative value as negative number.
Use Table 2 from Appendix B to determine the p-value.
Expert Solution
This question has been solved!
Explore an expertly crafted, step-by-step solution for a thorough understanding of key concepts.
This is a popular solution
Trending nowThis is a popular solution!
Step by stepSolved in 3 steps with 2 images

Knowledge Booster
Learn more about
Need a deep-dive on the concept behind this application? Look no further. Learn more about this topic, statistics and related others by exploring similar questions and additional content below.Similar questions
- Suppose that a customer is purchasing a car. He conducts an experiment in which he puts 10 gallons of gas in the car and drives it until it runs out of gas. He conducts this experiment 15 times on each car and records the number of miles driven. Full data set Car 1 211 215 234 212 247 264 260 164 256 251 171 319 292 313 252 Car 2 236 216 207 230 250 246 223 264 254 299 261 253 254 255 263arrow_forwardCan you also take a screenshot or list all the graphical procedures when doing the attached question by using Minitabarrow_forwardIn IBM SPSS, what does clicking on this icon do?arrow_forward
- A researcher thinks some social media sites are more prone to narcissistic behavior (excessive posting) than others. To examine the relationship between narcissism and social media, she recruits users of three different social media sites (Facebook, Twitter and Instagram), follows them for 24 hours and records the number of posts made by each user. The number of posts is given in the table below. Twitter Facebook Instagram 10 7 14 10 8. 10 10 10 11 9. www. 12 wwww. 11 13 12 8. 7 8. 11 8 10 12 11 11 a. Perform a complete hypothesis test to determine whether there are any significant differences among the three groups. Test at the .05 level of significance. SHOW ALL YOUR WORK b. Do you need to perform post hocs? Explain but do not compute the post hocs. C. Compute effect size. d. Summarize your findings in a source table. e. Write an interpretation of our results in APA-format (include means and SDs in your interpretation)arrow_forwardJohnson Filtration, Inc., provides maintenance service for water-filtration systems throughout southern Florida. Suppose that in addition to information on the number of months since the machine was serviced and whether a mechanical or an electrical repair was necessary, the managers obtained a list showing which repairperson performed the service. The revised data follow. Time bo + b₁ Months + b₂ Type + b3 Person Round your answers to three decimal places. bo b₁ b₂ b3 Repair Time in Hours 2.8 3.0 4.7 1.9 2.9 4.8 4.2 4.9 4.3 4.4 0000 Months Since Last Service 2 6 8 3 a. Develop the estimated regression equation to predict the repair time given the number of months since the last maintenance service, the type of repair, and the repairperson who performed the service. Assume that ₂ = 1 if the type of repair is electrical and 3 = 1 if Dave Newton performed the service. Enter negative value as negative number. 2 7 9 8 4 6 Type of Repair Electrical Mechanical Electrical Mechanical…arrow_forwardThe price drivers pay for gasoline often varies a great deal across regions throughout the United States. The following data show the price per gallon for regular gasoline for a random sample of gasoline service stations for three major brands of gasoline (Shell, BP, and Marathon) located in eleven metropolitan areas across the upper Midwest region (OhioGasPrices.com website, March 18, 2012). Click on the datafile logo to reference the data. DATA file Shell BP Metropolitan Area Marathon Akron, Ohio Cincinnati, Ohio Cleveland, Ohio Columbus, Ohio Ft. Wayne, Indiana Indianapolis, Indiana Lansing, Michigan Lexington, Kentucky Louisville, Kentucky Muncie, Indiana Toledo, Ohio 3.77 3.72 3.87 3.76 3.78 3.87 3.89 3.79 3.83 3.83 3.85 3.77 3.83 3.85 3.93 3.84 3.84 4.04 3.87 3.87 3.99 3.79 3.78 3.81 3.69 3.78 3.84 3.84 3.83 3.79 3.79 3.86 3.86 Use a = .05 to test for any significant difference in the mean price of gasoline for the three brands. Round SS to 6 decimals, MS to 6 decimals, F to 2…arrow_forward
- Mariah Jacobsen is the marketing manager at ABC Electronics, a major consumer electronics supplier in the northwest. Over the last five years, sales of the company's flagship product - the Wizer Anonymizer (the WA) - have been 45000, 45500, 44500, 46000 and 44000 units. This rate of sales is considered average for the product over the last twenty years or so. Ms. Jacobsen believes that the distribution of the WA's sales is normal with a standard deviation of 1500 units. If she were asked to make a forecast of next year's sales to upper management, what is the likelihood that she would be correct if she predicts sales between 43000 and 46000?arrow_forwardSuppose that a customer is purchasing a car. He conducts an experiment in which he puts 10 gallons of gas in the car and drives it until it runs out of gas. He conducts this experiment 15 times on each car and records the number of miles driven. Full data set Car 1 216 243 205 242 239 297 295 172 270 251 165 310 265 316 278 Car 2 231 220 223 205 245 257 242 292 248 252 287 255 250 293 251 Median for Car 2 M=___________mi / 10 gal (Type an integer or decimal rounded to one decimal place as needed.) Range for Car 1 R=__________mi / 10 gal (Type an integer or decimal rounded to one decimal place as needed.) Range for Car 2 R=__________mi / 10 gal (Type an integer or decimal rounded to one decimal place as needed.) Sample standard deviation for Car 1 s=_________mi / 10 gal (Type an integer or decimal rounded to one decimal place as needed.) Sample standard deviation…arrow_forwardClassify each of the following as nominal, ordinal, interval, or ratio data and explain. a. the time required to produce each car on an assembly line. b. the number of litres of water a family drinks in a month. c. the ranking of four student projects in your class after they have been designated as excellent, good, satisfactory, and poor. d. the telephone area code of clients in India. e. Explain the four groups of data in detail.arrow_forward
arrow_back_ios
arrow_forward_ios
Recommended textbooks for you
 MATLAB: An Introduction with ApplicationsStatisticsISBN:9781119256830Author:Amos GilatPublisher:John Wiley & Sons Inc
 Probability and Statistics for Engineering and th...StatisticsISBN:9781305251809Author:Jay L. DevorePublisher:Cengage Learning
 Statistics for The Behavioral Sciences (MindTap C...StatisticsISBN:9781305504912Author:Frederick J Gravetter, Larry B. WallnauPublisher:Cengage Learning
 Elementary Statistics: Picturing the World (7th E...StatisticsISBN:9780134683416Author:Ron Larson, Betsy FarberPublisher:PEARSON
 The Basic Practice of StatisticsStatisticsISBN:9781319042578Author:David S. Moore, William I. Notz, Michael A. FlignerPublisher:W. H. Freeman
 Introduction to the Practice of StatisticsStatisticsISBN:9781319013387Author:David S. Moore, George P. McCabe, Bruce A. CraigPublisher:W. H. Freeman

MATLAB: An Introduction with Applications
Statistics
ISBN:9781119256830
Author:Amos Gilat
Publisher:John Wiley & Sons Inc

Probability and Statistics for Engineering and th...
Statistics
ISBN:9781305251809
Author:Jay L. Devore
Publisher:Cengage Learning

Statistics for The Behavioral Sciences (MindTap C...
Statistics
ISBN:9781305504912
Author:Frederick J Gravetter, Larry B. Wallnau
Publisher:Cengage Learning

Elementary Statistics: Picturing the World (7th E...
Statistics
ISBN:9780134683416
Author:Ron Larson, Betsy Farber
Publisher:PEARSON

The Basic Practice of Statistics
Statistics
ISBN:9781319042578
Author:David S. Moore, William I. Notz, Michael A. Fligner
Publisher:W. H. Freeman

Introduction to the Practice of Statistics
Statistics
ISBN:9781319013387
Author:David S. Moore, George P. McCabe, Bruce A. Craig
Publisher:W. H. Freeman