
MATLAB: An Introduction with Applications
6th Edition
ISBN: 9781119256830
Author: Amos Gilat
Publisher: John Wiley & Sons Inc
expand_more
expand_more
format_list_bulleted
Related questions
Topic Video
Question
See the attached image for the introduction.
What are two-sided 95% confidence limits for the increase in
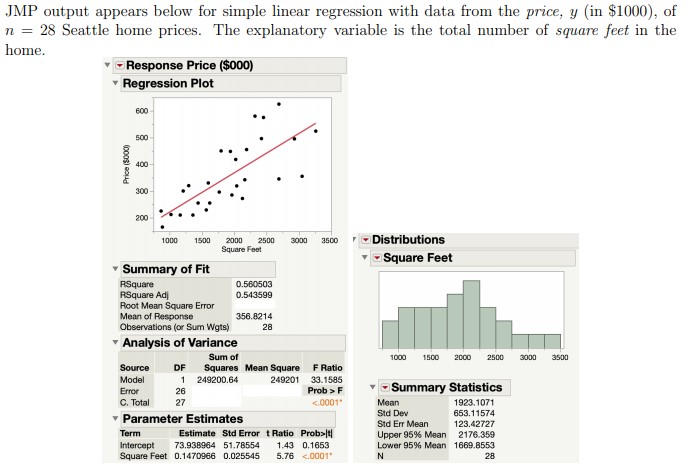

Transcribed Image Text:JMP output appears below for simple linear regression with data from the price, y (in $1000), of
n = 28 Seattle home prices. The explanatory variable is the total number of square feet in the
home.
- Response Price ($000)
Regression Plot
600
500
400
300
200
- Distributions
1000
1500
2000
2500
3000
3500
Square Feet
Square Feet
Summary of Fit
RSquare
RSquare Adi
Root Mean Square Error
Mean of Response
Observations (or Sum Wgts)
0.560503
0.543599
356.8214
28
Analysis of Variance
Sum of
1000
1500
2000
2500
3000
3500
Source
DF
F Ratio
Squares Mean Square
1 249200.64
Model
249201 33.1585
- Summary Statistics
Error
26
Prob > F
C. Total
27
<.0001
Mean
1923.1071
Std Dev
653.11574
v Parameter Estimates
Std Er Mean
123.42727
Term
Estimate Std Error t Ratio Prob>lt
Upper 95% Mean 2176.359
Lower 95% Mean 1669.8553
Intercept
Square Feet 0.1470966 0.025545
73.938964 51.78554
1.43 0.1653
5.76 <.0001
28
(ooos) eoad
Expert Solution
This question has been solved!
Explore an expertly crafted, step-by-step solution for a thorough understanding of key concepts.

This is a popular solution

Trending nowThis is a popular solution!

Step by stepSolved in 2 steps with 1 images

Knowledge Booster


Learn more about
Need a deep-dive on the concept behind this application? Look no further. Learn more about this topic, statistics and related others by exploring similar questions and additional content below.Similar questions
- For each research question, explain what research design you would recommend. Also, identify how you would analyze the data. 1. A group who watches a scary movie will have the highest anxiety scores, followed by the group who watches science fiction. The group that watches a comedy will have the lowest anxiety scores.arrow_forwardThe name of your cat is an example of nominal data. True Falsearrow_forwardUsing the same data and information. Please answer this: Should you be encouraging or discouraging credit card sales? In answering this question, consider the following: Is the proportion of credit and non-credit sales significantly different? (a=.05) Is the average sale amount for credit sales different than the average sales amount for non-credit sales? (a=.05)arrow_forward
- A set of data has a histogram that is extremely skewed, what does this tell you about the data and how observations will tend to fall around the mean?arrow_forwardA sample of 30 commuters in the area of a certain city yielded the accompanying commute times, in minutes. Preliminary data analyses indicate that the t-interval procedu interval for the mean commute time of all commuters in the area of the city. (Note: x= 27.47 minutes and s 9.81 minutes.) Click here to view the commute times. Click here to view page 1 of the t-table. Click here to view page 2 of the t-table. an reasonably be applied. Find and interpret a 99% confidence ..... The 99% confidence interval is from minute(s) to minute(s). (Round to one decimal place as needed.) Commute times 22 28 33 26 42 29 27 36 25 14 47 39 32 15 18 11 21 17 30 26 15 21 28 17 29 46 18 36 36 40 Print Done Clear all Check answer View an example Get more help - Help me solve this NOV W 3,769 étv 23 280 MacBook Air DII F11 F12 吕口 888 F10 • F7 F8 F9 F5 F6 F4 esc F2 F3 F1 & %23 %24 dele 7 8 9- 2 4. E R Y. 会 w/arrow_forwardA realtor is displaying the histogram below, which summarizes the percentage appreciation in value (over the past five years) for each of a random sample of 25 houses in Newburg Park. Relative frequency 0.4 0.32 03- 0.2 0.2 0.2 016 0.12 0.1 10 20 40 Appreciation (in percent) Based on the histogram, draw the ogive (the ccumulative relative frequency polygon) for the sample data. Cumulative relative froquency 0.6 0.4 02 0.00 0.00 [0.00 T0.00 0.0 10 20 30 40 30 Appreciation (in percent)arrow_forward
arrow_back_ios
arrow_forward_ios
Recommended textbooks for you
- MATLAB: An Introduction with ApplicationsStatisticsISBN:9781119256830Author:Amos GilatPublisher:John Wiley & Sons Inc
 Probability and Statistics for Engineering and th...StatisticsISBN:9781305251809Author:Jay L. DevorePublisher:Cengage Learning
 Statistics for The Behavioral Sciences (MindTap C...StatisticsISBN:9781305504912Author:Frederick J Gravetter, Larry B. WallnauPublisher:Cengage Learning
  Elementary Statistics: Picturing the World (7th E...StatisticsISBN:9780134683416Author:Ron Larson, Betsy FarberPublisher:PEARSON
 The Basic Practice of StatisticsStatisticsISBN:9781319042578Author:David S. Moore, William I. Notz, Michael A. FlignerPublisher:W. H. Freeman
 Introduction to the Practice of StatisticsStatisticsISBN:9781319013387Author:David S. Moore, George P. McCabe, Bruce A. CraigPublisher:W. H. Freeman
MATLAB: An Introduction with Applications
Statistics
ISBN:9781119256830
Author:Amos Gilat
Publisher:John Wiley & Sons Inc
Probability and Statistics for Engineering and th...
Statistics
ISBN:9781305251809
Author:Jay L. Devore
Publisher:Cengage Learning
Statistics for The Behavioral Sciences (MindTap C...
Statistics
ISBN:9781305504912
Author:Frederick J Gravetter, Larry B. Wallnau
Publisher:Cengage Learning
Elementary Statistics: Picturing the World (7th E...
Statistics
ISBN:9780134683416
Author:Ron Larson, Betsy Farber
Publisher:PEARSON
The Basic Practice of Statistics
Statistics
ISBN:9781319042578
Author:David S. Moore, William I. Notz, Michael A. Fligner
Publisher:W. H. Freeman
Introduction to the Practice of Statistics
Statistics
ISBN:9781319013387
Author:David S. Moore, George P. McCabe, Bruce A. Craig
Publisher:W. H. Freeman