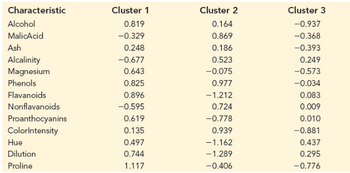
2. Jay Gatsby categorizes wines into one of three clusters. The centroids of these clusters, describing the average characteristics of a wine in each cluster, are listed in the following table.
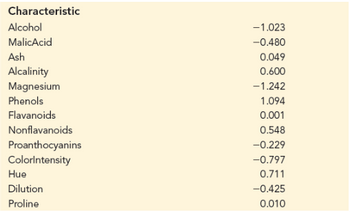
Jay has recently discovered a new wine from the Piedmont region of Italy with the following characteristics. In which cluster of wines should he place this new wine? Justify your choice with appropriate calculations.
Answer the ff:
If required, round your answers to three decimal places. Do not round intermediate calculations.
Distance from new wine and Cluster 1:
Distance from new wine and Cluster 2:
Distance from new wine and Cluster 3:
What is the most appropriate for the new wine observation?


Trending nowThis is a popular solution!
Step by stepSolved in 2 steps

- A County Board of Supervisors has appointed an urban planning committee to evaluate proposed community development projects. The committee is analyzing, among other things, data on household incomes in two cities within the county. They have collected data on the income of 80 households in each of the two cities. The histograms below show the distributions of the two sets of incomes (in thousands of dollars). Each histogram shows household income on the horizontal axis and number of households on the vertical axis. The means and standard deviations for the data sets are also given. City A City B 25- 25 - 20+ 20- 15- 15- 10+ 10- 5+ 5- 0- 10 20 30 40 50 60 70 80 90 100 10 20 30 40 50 60 70 80 90 100 City A mean: 38.13 thousand dollars City B mean: 55.13 thousand dollars City A standard deviation: 20.84 thousand dollars City B standard deviation: 14.71 thousand dollars The committee wants to use the Empirical Rule to make some approximations about both data sets. Unfortunately, it is…arrow_forward2.) Explain why the relative frequency column of a frequency table might not sum to 1.0.arrow_forwardThe following data are the maximum temperatures (in degrees Fahrenheit) of 17 cities in the United states measured on the same day. 53 70 65 74 85 76 84 70 61 59 54 66 56 71 81 73 76 Construct a box and whisker plot for the data.arrow_forward
- The following table shows the number of hours some high school students in 2 cities spend watching television each week: City A 21 23 24 22 24 25 23 23 22 City B 24 22 20 23 23 50 20 46 21 Part A: Create a five-number summary and calculate the interquartile range for the two sets of data, and tell whats the best measure of center. Justify.arrow_forwardA County Board of Supervisors has appointed an urban planning committee to evaluate proposed community development projects. The committee is analyzing, among other things, data on household incomes in two cities within the county. They have collected data on the income of 77 households in each of the two cities. The histograms below show the distributions of the two sets of incomes (in thousands of dollars). Each histogram shows household income on the horizontal axis and number of households on the vertical axis. The means and standard deviations for the data sets are also given. City A City B 25+ 20+ 15+ 10+ 5- ← 10 20 30 40 50 60 70 80 90 100 City A mean: 73.96 thousand dollars City A standard deviation: 20.30 thousand dollars Explanation 25- 20- 15- 104 5+ 10 (a) Identify the data set for which it is appropriate to use the Empirical Rule. It is appropriate to use the Empirical Rule for the (Choose one) ▼ data set. 20 30 The committee wants to use the Empirical Rule to make some…arrow_forwardFor the following example indicate the type of data involved using the following: A = nominal data B = ordinal data C = interval data 5. Category ranking of a hurricane.arrow_forward
- The authors of a paper were interested in how the distance a deer mouse will travel for food is related to the distance from the food to the nearest pile of debris. Distances were measured in meters. The data and computer output are given below. Distance from Debris Distance Traveled 6.94 0.00 5.23 6.13 5.21 11.29 7.10 14.35 8.16 12.03 5.50 22.72 9.19 20.11 9.05 26.16 9.36 30.65 Simple Linear Regression Results: Dependent Variable: Traveled Independent Variable: Debris Sample size: 9 R (correlation coefficient) = 0.5657 R-sq = 0.32002088 Estimate of error standard deviation 8.670711 Parameter estimates: Parameter Estimate Std. Err. Alternative DF T-Stat P-Value Intercept -7.6854587 13.332196 ≠ 0 7 -0.5764586 0.5824 Slope 3.2340908 1.7818117 ≠ 0 7 1.8150575 0.1124 a)What is the least squares regression line for the output given above? b) what is the predicted traveled distance given the distance from debris is 6.5 meters?arrow_forward4. Draw a line / curve of best fit for the following sets of data & identify if they are linear, quadratic or exponential: 2500 1500 1000 500 300 200 -100 25 50arrow_forwardA population data set produced the following information. N = 250. Ex = 9980, Ey = 1455, xy = 85,040 E2 = 486,820, and = 136,745 Find the values of oe and p?. Round oe to four decimal places and p? to three decimal places. iarrow_forward
 MATLAB: An Introduction with ApplicationsStatisticsISBN:9781119256830Author:Amos GilatPublisher:John Wiley & Sons Inc
 Probability and Statistics for Engineering and th...StatisticsISBN:9781305251809Author:Jay L. DevorePublisher:Cengage Learning
 Statistics for The Behavioral Sciences (MindTap C...StatisticsISBN:9781305504912Author:Frederick J Gravetter, Larry B. WallnauPublisher:Cengage Learning
 Elementary Statistics: Picturing the World (7th E...StatisticsISBN:9780134683416Author:Ron Larson, Betsy FarberPublisher:PEARSON
 The Basic Practice of StatisticsStatisticsISBN:9781319042578Author:David S. Moore, William I. Notz, Michael A. FlignerPublisher:W. H. Freeman
 Introduction to the Practice of StatisticsStatisticsISBN:9781319013387Author:David S. Moore, George P. McCabe, Bruce A. CraigPublisher:W. H. Freeman


