MATLAB: An Introduction with Applications
6th Edition
ISBN: 9781119256830
Author: Amos Gilat
Publisher: John Wiley & Sons Inc
expand_more
expand_more
format_list_bulleted
Question

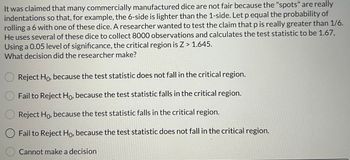
Transcribed Image Text:It was claimed that many commercially manufactured dice are not fair because the "spots" are really
indentations so that, for example, the 6-side is lighter than the 1-side. Let p equal the probability of
rolling a 6 with one of these dice. A researcher wanted to test the claim that p is really greater than 1/6.
He uses several of these dice to collect 8000 observations and calculates the test statistic to be 1.67,
Using a 0.05 level of significance, the critical region is Z> 1.645.
What decision did the researcher make?
Reject Ho, because the test statistic does not fall in the critical region.
Fail to Reject Ho, because the test statistic falls in the critical region.
Reject Ho, because the test statistic falls in the critical region.
Fail to Reject Ho, because the test statistic does not fall in the critical region.
Cannot make a decision
Expert Solution
This question has been solved!
Explore an expertly crafted, step-by-step solution for a thorough understanding of key concepts.
Step by stepSolved in 3 steps

Knowledge Booster
Similar questions
- A hospital administrator finds that the mean hospital stay for a sample of 77 women after childbirth is 3.1 days. She claims that the mean stay at her hospital is greater than the national average of 2.7 days. Assuming that the average at her hospital is the same as the national average, the probability of observing a sample with a mean of 3.1 days or more is 0.16. Formulate the null and alternative hypotheses. Then discuss whether the sample provides evidence for rejecting or not rejecting the null hypothesis. Assume a significance level of 0.05.arrow_forwardThe U.S. Health Department reported that 40% of households had both a wireless phone and a landline. Assume that in a simple random sample of 300 households, 105 are found to have both services. With this information answer the following questions: What is the population proportion, π? What is the sample proportion, p? What is the standard error of the sample proportion? In the sampling distribution of the proportion, what is the probability that a sample of this size would result in a sample proportion at least 35%?arrow_forwardSuppose the following data represent the ratings (on a scale from 1 to 5) for a certain smart phone game, with 1 representing a poor rating. Complete parts (a) through (d) below. 2 3 (c) Compute and interpret the mean of the random variable x. The mean is stars. (Round to one decimal place as needed.) Which of the following interpretations of the mean is correct? 3 4 C 0.1+ OA. As the number of experiments increases, the mean of the observations will approach the mean of the random variable. OB. The observed value of an experiment will be equal to the mean of the random variable in most experiments. OC. As the number of experiments decreases, the mean of the observations will approach the mean of the random variable. OD. The observed value of an experiment will be less than the mean of the random variable in most experiments. (d) Compute the standard deviation of the random variable x. The standard deviation is stars. (Round to one decimal place as needed.). 0.1+ Stars 1 2 3 4 5…arrow_forward
- Do you think new package labeling or doing nothing is best? You will want to calculate the percent of bars produced that are within 5 grams of 1000 grams and the percent of bars produced that are within 5 grams of 990 grams. In other words, given a uniform distribution between 980 and 1000, what is the probability of being between 995 and 1005 and what is the probability of being between 985 and 995?arrow_forwardThe general philosophy of standardizing is that standardizing a random variable involves a. Subtracting the main in the batting by the standard deviation b. Dividing the standard deviation of the total of successes by the total of trials c. Adding and subtracting standard deviations in each direction d. Subtracting the area in the right tail from 1 since the Z chart gives only the area "to the left"arrow_forwardThe U.S. Fish and Wildlife Service reported that the lengths of six-year-old rainbow trout in the Arolik River in Alaska are normally distributed with a mean of 481 millimeters and standard deviation of 41 millimeters. If a six-year-old rainbow trout from the Arolik River is selected at random, what is the probability it's length is more than 500 millimeters? Question 5 options: 0.1588 0.3215 0.4576 0.6785arrow_forward
- Some exceptionally large snakes, the reason for their size yet unknown to scientists, were studied in a certain area of South America. The weights of the studied population are strongly right‑skewed with mean 36 kg and standard deviation 7 kg. A random sample of 10 snakes is taken from that population. What is the probability that the average weight of the sample is more than 38 kg? 0.3875 cannot say 0.1831arrow_forwardWhat is the probability of obtaining a z score that is as extreme as or more extreme than 1.96?arrow_forwardPlease provide step by step on each of the following to be able to construct the probability distribution table. I came up with 0=1/9 .5=4/9 1= 4/9 but the answer is as follows: 0=4/9 .5=4/9 1=1/9 Three randomly selected households are surveyed. The numbers of people in the households are 4, 5, and 9. Assume that samples of size n=2 are randomly selected with replacement from the population of 4, 5, and 9. Construct a probability distribution table that describes the sampling distribution of the proportion of even numbers when samples of sizes nequals=2 are randomly selected. Does the mean of the sample proportions equal the proportion of evennumbers in the population? Do the sample proportions target the value of the population proportion? Does the sample proportion make a good estimator of the population proportion? Listed below are the nine possible samples. 4,4 4,5 4,9 5,4 5,5 5,9 9,4 9,5 9,9, Thank youarrow_forward
- A recent study showed that 71% of adults need some type of corrective lens (glasses or contacts). A. If I grab a 6 random people what is the probability that fewer than 4 need corrective lenses? B. If I take a random sample of 2000 people what is the mean and standard deviation of the number of people who need corrective lens? C. Use the normal approximation to the binomial to find the probability that I get 1375 or fewer people who need corrective lenses out of a random sample of 2000. Illustrate what you are finding on a sketch of the normal curve and show your work.arrow_forwardMany consumers pay careful attention to stated nutritional contents on packaged foods when making purchases. It is therefore important that the information on packages be accurate. A random sample of n = 12 frozen dinners of a certain type was selected from production during a particular period, and the calorie content of each one was determined. (This determination entails destroying the product, so a census would certainly not be desirable!) Here are the resulting observations, along with a boxplot and normal probability plot. (Use this dataset for your analysis software.) 255 244 239 242 265 245 259 248 225 226 251 233 n USE SALT 27아 265 26아 255 25아 245 - 240- 235 23아 225 -1.5 -0.5 0.5 1.5 22아 Normal score (a) Is it reasonable to test hypotheses about mean calorie content u by using a t test? Explain why or why not. O Yes, it is reasonable. The pattern in the normal probability plot is roughly linear, and since the sample was a random sample from the population, the t test is…arrow_forward
arrow_back_ios
arrow_forward_ios
Recommended textbooks for you
 MATLAB: An Introduction with ApplicationsStatisticsISBN:9781119256830Author:Amos GilatPublisher:John Wiley & Sons Inc
 Probability and Statistics for Engineering and th...StatisticsISBN:9781305251809Author:Jay L. DevorePublisher:Cengage Learning
 Statistics for The Behavioral Sciences (MindTap C...StatisticsISBN:9781305504912Author:Frederick J Gravetter, Larry B. WallnauPublisher:Cengage Learning
 Elementary Statistics: Picturing the World (7th E...StatisticsISBN:9780134683416Author:Ron Larson, Betsy FarberPublisher:PEARSON
 The Basic Practice of StatisticsStatisticsISBN:9781319042578Author:David S. Moore, William I. Notz, Michael A. FlignerPublisher:W. H. Freeman
 Introduction to the Practice of StatisticsStatisticsISBN:9781319013387Author:David S. Moore, George P. McCabe, Bruce A. CraigPublisher:W. H. Freeman

MATLAB: An Introduction with Applications
Statistics
ISBN:9781119256830
Author:Amos Gilat
Publisher:John Wiley & Sons Inc

Probability and Statistics for Engineering and th...
Statistics
ISBN:9781305251809
Author:Jay L. Devore
Publisher:Cengage Learning

Statistics for The Behavioral Sciences (MindTap C...
Statistics
ISBN:9781305504912
Author:Frederick J Gravetter, Larry B. Wallnau
Publisher:Cengage Learning

Elementary Statistics: Picturing the World (7th E...
Statistics
ISBN:9780134683416
Author:Ron Larson, Betsy Farber
Publisher:PEARSON

The Basic Practice of Statistics
Statistics
ISBN:9781319042578
Author:David S. Moore, William I. Notz, Michael A. Fligner
Publisher:W. H. Freeman

Introduction to the Practice of Statistics
Statistics
ISBN:9781319013387
Author:David S. Moore, George P. McCabe, Bruce A. Craig
Publisher:W. H. Freeman