
MATLAB: An Introduction with Applications
6th Edition
ISBN: 9781119256830
Author: Amos Gilat
Publisher: John Wiley & Sons Inc
expand_more
expand_more
format_list_bulleted
Related questions
Question
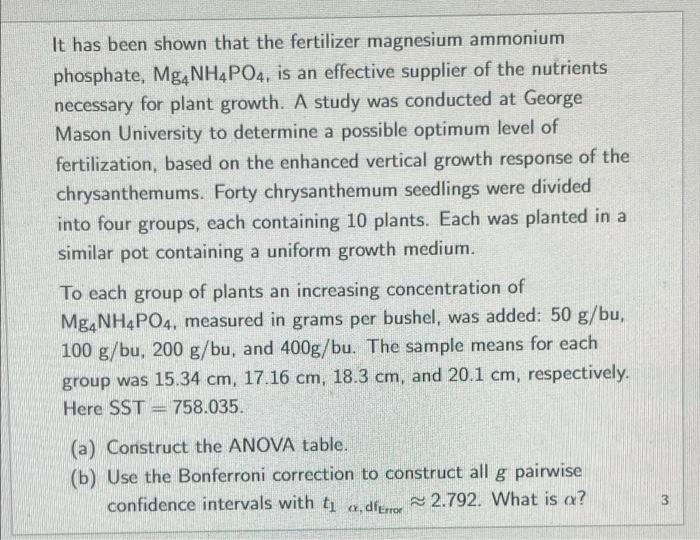

Transcribed Image Text:It has been shown that the fertilizer magnesium ammonium
phosphate, Mg, NH4PO4, is an effective supplier of the nutrients
necessary for plant growth. A study was conducted at George
Mason University to determine a possible optimum level of
fertilization, based on the enhanced vertical growth response of the
chrysanthemums. Forty chrysanthemum seedlings were divided
into four groups, each containing 10 plants. Each was planted in a
similar pot containing a uniform growth medium.
To each group of plants an increasing concentration of
Mg,NH4PO4, measured in grams per bushel, was added: 50 g/bu,
100 g/bu, 200 g/bu, and 400g/bu. The sample means for each
group was 15.34 cm, 17.16 cm, 18.3 cm, and 20.1 cm, respectively.
Here SST = 758.035.
(a) Construct the ANOVA table.
(b) Use the Bonferroni correction to construct all g pairwise
confidence intervals with t a df 2.792. What is a?
3
Expert Solution
This question has been solved!
Explore an expertly crafted, step-by-step solution for a thorough understanding of key concepts.

This is a popular solution

Trending nowThis is a popular solution!

Step by stepSolved in 2 steps

Knowledge Booster

Similar questions
- Reducing scrap of 4-foot planks of hardwood is an important factor in reducing cost at a wood-flooring manufacturing company. Accordingly, engineers at Lumberworks are investigating a potential new cutting method involving lateral sawing that may reduce the scrap rate. To examine its viability, samples of 600 and 500 planks, respectively, were examined under the old and new methods. Sixty-two of the 600 planks were scrapped under the old method, whereas 34 of the 500 planks were scrapped under the new method. (You may find it useful to reference the appropriate table: z table or t table) a. Construct the 90% confidence interval for the difference between the population scrap rates between the old and new methods, respectively. (Negative values should be indicated by a minus sign. Round intermediate calculations to at least 4 decimal places and final answers to 2 decimal places.) Confidence interval is I to %. 論arrow_forwardDuring the 2013 season, Major League Baseball took steps to speed up the play of baseball games in order to maintain fan interest. The average duration of a game from a sample of 60 games played during the summer of 2012 was 2 hours and 52 minutes. The average duration of a game from a sample of 50 games played during the summer of 2013 was 2 hours and 46 minutes. For the purposes of this question, let 2013 games be population 1. 1a. A research hypothesis was that the steps taken during the 2013 season would reduce the population mean duration of baseball games. Formulate null and alternative hypotheses. 1b. What is the point estimate of the reduction in the mean duration of games during the 2003 season?arrow_forwardTo determine how climate change and habitat loss will influence Antarctic species, baseline estimates of population sizes and distributions are needed. To this end, a group of researchers estimated the population sizes of all breeding colonies of emperor penguins (Aptenodytes fosteri) along Antarctic coastlines using satellite imagery (Fretwell et al., 2012). For each breeding colony encountered, the researchers determined the latitude, longitude, and area (m2) of the colony, and estimated the total number of emperor penguins present. Then, they compared their colony size estimates to previously published estimates. Suppose the researchers want to determine if there is a linear relationship between the previous population estimates and the current population estimates, so they decide to conduct a two-tailed T test for no linear relationship. From 29 data points, they calculate the linear regression equation to be Y^ =925.25556+0.71001x where ?Y^ is the predicted current population…arrow_forward
- Ramp metering is a traffic engineering idea that requires cars entering a freeway to stop for a certain period of time before joining the traffic flow. The theory is that ramp metering controls the number of cars on the freeway and the number of cars accessing the freeway, resulting in a freer flow of cars, which ultimately results in faster travel times. To test whether ramp metering is effective in reducing travel times, engineers conducted an experiment in which a section of freeway had ramp meters installed on the on-ramps. The response variable for the study was speed of the vehicles. A random sample of 15 cars on the highway for a Monday at 6 p.m. with the ramp meters on and a second random sample of 15 cars on a different Monday at 6 pm with the meters off resulted in the following speeds (in miles per hour). (a) Uraw side-by-side Doxplots of each data set Does there appear to be a merence in the speeds? Are there any outlers? Choose the correct Dox plot below. A. 0 Off 15 30 45…arrow_forwardReducing scrap of 4-foot planks of hardwood is an important factor in reducing cost at a wood-flooring manufacturing company. Accordingly, engineers at Lumberworks are investigating a potential new cutting method involving lateral sawing that may reduce the scrap rate. To examine its viability, samples of 600 and 500 planks, respectively, were examined under the old and new methods. Sixty-one of the 600 planks were scrapped under the old method, whereas 36 of the 500 planks were scrapped under the new method. (You may find it useful to reference the appropriate table: z table or t table)a. Construct the 99% confidence interval for the difference between the population scrap rates between the old and new methods, respectively. (Negative values should be indicated by a minus sign. Round intermediate calculations to at least 4 decimal places and final answers to 2 decimal places.)arrow_forwardCopepods are tiny crustaceans that are an essential link in the estuarine food web. Marine scientists designed an experiment to determine whether dietary lipid Diatoms Bacteria Macroalgae 421 304 290 (fat) content is important in the population growth of a copepod. Independent random samples of copepods were placed in containers containing lipid-rich diatoms, bacteria, or leafy macroalgae. There were 12 containers total with four replicates per diet. Five gravid (egg-bearing) females were placed in each container. After 14 days, the number of copepods in each container were as given to the right. At the 5% significance level, do the data provide sufficient evidence to conclude that a difference exists in mean number of copepods among the three different diets? 296 312 300 295 326 267 Click here to view page 1 of the F-distribution. Click here to view page 2 of the F-distribution. Click here to view page 3 of the F-distribution. Click here to view page 4 of the F-distribution. First,…arrow_forward
- A study was conducted to demonstrate that soybeans inoculated with nitrogen-fixing bacteria yield more and grow adequately without expensive environmentally deleterious synthesized fertilizers. The trial was conducted under controlled conditions with uniform amounts of soil. The initial hypothesis was that inoculated plants would outperform their uninoculated counterparts. This assumption is based on the facts that plants need nitrogen to manufacture vital proteins and amino acids and that nitrogen-fixing bacteria would make more of this substance available to plants, increasing their size and yield. There were 8 inoculated plants (I) and 8 uninoculated plants (U). The plant yield as measured by pod weight for each plant is given in Table 2.20. Compute appropriate descriptive statistics for I and Data set available U plants.arrow_forwardBeryllium is an extremely lightweight metal that is used in many industries, such as aerospace and electronics. Long-term exposure to beryllium can cause people to become sensitized. Once an individual is sensitized, continued exposure can result in chronic beryllium disease, which involves scarring of the lungs. In a study of the effects of exposure to beryllium, workers were categorized by their duration of exposure (in years) and by their disease status (diseased, sensitized, or normal). The results were as follows: Duration of Exposure <1 1 to <5 ≥5 Diseased 14 13 18 Sensitized 11 20 15 Normal 78 140 209 Test the hypothesis of independence. Use the a=0.10 level of significance and the P-value method with the TI-84 Plus calculator. What do you conclude? State the null and alternate hypotheses.arrow_forwardThe actual color a viewer sees on a screen is influenced by the specific type and amount of phosphors on the screen. So each computer screen manufacturer must convert between the (R, G, B) data and an international CIE standard for color, which uses three primary colors, called X, Y, and Z. A typical conversion for short-persistence phosphors is shown to the right. A computer program will send a stream of color information to the screen, using standard CIE data (X, Y, Z). Find the equation that converts these data to the (R, G, B) data needed for the screen's electron gun. G 121 1²2 cal forach mement Round to four decimal place) (Type an or as Y C 0.45 0.26 0.158 0.34 0.65 0.063 0.02 0.16 0.841 R B X Y Zarrow_forward
arrow_back_ios
arrow_forward_ios
Recommended textbooks for you
- MATLAB: An Introduction with ApplicationsStatisticsISBN:9781119256830Author:Amos GilatPublisher:John Wiley & Sons Inc
 Probability and Statistics for Engineering and th...StatisticsISBN:9781305251809Author:Jay L. DevorePublisher:Cengage Learning
 Statistics for The Behavioral Sciences (MindTap C...StatisticsISBN:9781305504912Author:Frederick J Gravetter, Larry B. WallnauPublisher:Cengage Learning
  Elementary Statistics: Picturing the World (7th E...StatisticsISBN:9780134683416Author:Ron Larson, Betsy FarberPublisher:PEARSON
 The Basic Practice of StatisticsStatisticsISBN:9781319042578Author:David S. Moore, William I. Notz, Michael A. FlignerPublisher:W. H. Freeman
 Introduction to the Practice of StatisticsStatisticsISBN:9781319013387Author:David S. Moore, George P. McCabe, Bruce A. CraigPublisher:W. H. Freeman
MATLAB: An Introduction with Applications
Statistics
ISBN:9781119256830
Author:Amos Gilat
Publisher:John Wiley & Sons Inc
Probability and Statistics for Engineering and th...
Statistics
ISBN:9781305251809
Author:Jay L. Devore
Publisher:Cengage Learning
Statistics for The Behavioral Sciences (MindTap C...
Statistics
ISBN:9781305504912
Author:Frederick J Gravetter, Larry B. Wallnau
Publisher:Cengage Learning
Elementary Statistics: Picturing the World (7th E...
Statistics
ISBN:9780134683416
Author:Ron Larson, Betsy Farber
Publisher:PEARSON
The Basic Practice of Statistics
Statistics
ISBN:9781319042578
Author:David S. Moore, William I. Notz, Michael A. Fligner
Publisher:W. H. Freeman
Introduction to the Practice of Statistics
Statistics
ISBN:9781319013387
Author:David S. Moore, George P. McCabe, Bruce A. Craig
Publisher:W. H. Freeman