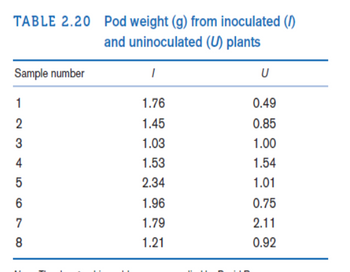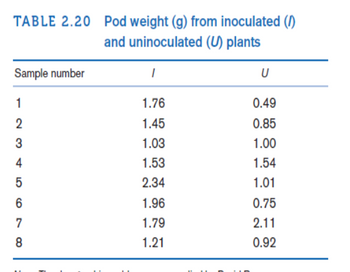
A study was conducted to demonstrate that soybeans inoculated with nitrogen-fixing bacteria yield more and grow adequately without expensive environmentally deleterious synthesized fertilizers. The trial was conducted under controlled conditions with uniform amounts of soil. The initial hypothesis was that inoculated plants would outperform their uninoculated counterparts. This assumption is based on the facts that plants need nitrogen to manufacture vital proteins and amino acids and that nitrogen-fixing bacteria would make more of this substance available to plants, increasing their size and yield. There were 8 inoculated plants (I) and 8 uninoculated plants (U). The plant yield as measured by pod weight for each plant is given in Table 2.20.
Compute appropriate

Trending nowThis is a popular solution!
Step by stepSolved in 4 steps

A study was conducted to demonstrate that soybeans inoculated with nitrogen-fixing bacteria yield more and grow adequately without expensive environmentally deleterious synthesized fertilizers. The trial was conducted under controlled conditions with uniform amounts of soil. The initial hypothesis was that inoculated plants would outperform their uninoculated counterparts. This assumption is based on the facts that plants need nitrogen to manufacture vital proteins and amino acids and that nitrogen-fixing bacteria would make more of this substance available to plants, increasing their size and yield. There were 8 inoculated plants (I) and 8 uninoculated plants (U). The plant yield as measured by pod weight for each plant is given in Table 2.20
Here are the questions I would like explanations for. Please use STATA to compute answers!!!:
2.35. The objective is to compute appropriate
2.36. Use graphic methods to compare the two groups I and U
2.37.What is your overall impression concerning the pod weight in the two groups?

- The variables in our dataset include the college grade point average (colGPA), high school GPA (hsGPA), and achievement test score (ACT) for a sample of 141 students from a large university; both college and high school GPAs are on a four- point scale. We estimate the following model by OLS: colGPA=β₁+β₂hsGPA+β₃ACT+u,and obtain the following parameter estimates β₁=1, β₂=0.5, and β₃=0.02. Predict difference of college GPA's of two students (colGPAB-colGPAA) where the student B has a 0.4 higher GPA in high school and 5 points higher ACT score compared to student A.arrow_forwardIt has been shown that the fertilizer magnesium ammonium phosphate, Mg, NH4PO4, is an effective supplier of the nutrients necessary for plant growth. A study was conducted at George Mason University to determine a possible optimum level of fertilization, based on the enhanced vertical growth response of the chrysanthemums. Forty chrysanthemum seedlings were divided into four groups, each containing 10 plants. Each was planted in a similar pot containing a uniform growth medium. To each group of plants an increasing concentration of Mg,NH4PO4, measured in grams per bushel, was added: 50 g/bu, 100 g/bu, 200 g/bu, and 400g/bu. The sample means for each group was 15.34 cm, 17.16 cm, 18.3 cm, and 20.1 cm, respectively. Here SST = 758.035. (a) Construct the ANOVA table. (b) Use the Bonferroni correction to construct all g pairwise confidence intervals with t a df 2.792. What is a?arrow_forwardResearchers have suggested that sleep apnoea (the tendency to occasionally stop breathing when asleep) may worsen the effects of allergen-induced asthma. To investigate this possibility, Johnson and colleagues (2015), compared two groups of rats, a normal healthy non-allergic group, and a second group that were mildly allergic to ovalbumin. They subjected these rats to one of two treatments – 1) a 10-minute period of induced hypoxia (oxygen down to 10% of the air), representing the kind of temporary hypoxia that sufferers of sleep apnoea may be subjected to, and 2) a control (normal air) group. They then compared the respiratory function of both groups in these two treatments by using a two-factor ANOVA. What are the 3 null hypotheses are being tested in the ANOVA? What is the result of the test of the interaction effect from this analysis? What would be the most correct interpretation this result, based on the plot of means? Source df F P Rat type 1…arrow_forward
- People with chronic airflow obstruction are believed to have a limited exercise tolerance. This limited tolerance is thought to be mainly due to impaired ventilation mechanics. In a study designed to measure the effect (if any) that a new treatment had on the exercise capacities of individuals with chronic airflow obstruction, investigators measured, among other things, maximum exercise ventilation (VEmax) before and after the treatment was applied. The raw VEmax data are reproduced in the table below. The investigators would like to determine if there was an increase in the maximum exercise volume as a result of the treatment. Let ? = 0.025. Baseline 20.6 18.8 20.7 20.1 21.2 22.7 22.3 22.9 19.0 After Treatment 21.9 20.9 20.9 21.3 22.8 27.1 23.3 18.7 25.4 Diff 1.3 2.1 0.2 1.2 1.6 4.4 1 -4.2 6.4 E) The test statistic for this data set is F) The P-value for this study is:arrow_forwardResearchers are interested in testing the effectiveness of a new immunosuppressive therapy to be used post-transplant to reduce graft failure in the host. Suppose researchers investigating this new therapy are concerned about the dangerous side-effects of the drug. For instance, participants that would like to enroll in the study are not allowed to already have diabetes, as the immunosuppressive agent has been found to drastically increase fasting glucose levels, which could be very dangerous for diabetics. This means, however, that participants that enter and are treated with the new drug may develop diabetes as time goes on. Suppose the following table addresses the incidence of diabetes in the study depending on treatment group. (α=.01) Type II Diabetes No Type II Diabetes Total Investigational Drug 45 32 77 Best standard of Care 35 50 85 Total 80 82 162 Based on this information complete the hypothesis steps for Chi-Squared below:…arrow_forwardA DJI drone builder states in their terms of conditions that the battery for their foldable drone will last for more than 4 hours of continuous flight-time if the battery was fully charged before the flight. To test this, claim a sample of n = 10 drones were tested. The results showed a sample mean of 4.2 hours and a sample standard deviation of 0.4 hours. Conduct the hypothesis test using a 0.5 level of significance and determine whether or not the manufacturers claim is supported.arrow_forward
- PLE collects a variety of data from special studies, many of which are related to the quality of its products. The company collects data about functional test performance of its mowers after assembly; results from the past 30 days are given in the worksheet Mower Test. In addition, many in-process measurements are taken to ensure that manufacturing processes remain in control and can produce according to design specifications. The worksheet Blade Weight shows 350 measurements of blade weights taken from the manufacturing process that produces mower blades during the most recent shift. Elizabeth Burke has asked you to study these data from an analytics perspective. Drawing upon your experience, you have developed a number of questions: For the mower test data, what distribution might be appropriate to model the failure of an individual mower? What fraction of mowers fails the functional performance test using all the mower test data? What is the probability of having x failures in the…arrow_forwardBeryllium is an extremely lightweight metal that is used in many industries, such as aerospace and electronics. Long-term exposure to beryllium can cause people to become sensitized. Once an individual is sensitized, continued exposure can result in chronic beryllium disease, which involves scarring of the lungs. In a study of the effects of exposure to beryllium, workers were categorized by their duration of exposure (in years) and by their disease status (diseased, sensitized, or normal). The results were as follows: Duration of Exposure <1 1 to <5 ≥5 Diseased 14 13 18 Sensitized 11 20 15 Normal 78 140 209 Test the hypothesis of independence. Use the a=0.10 level of significance and the P-value method with the TI-84 Plus calculator. What do you conclude? State the null and alternate hypotheses.arrow_forward
 MATLAB: An Introduction with ApplicationsStatisticsISBN:9781119256830Author:Amos GilatPublisher:John Wiley & Sons Inc
 Probability and Statistics for Engineering and th...StatisticsISBN:9781305251809Author:Jay L. DevorePublisher:Cengage Learning
 Statistics for The Behavioral Sciences (MindTap C...StatisticsISBN:9781305504912Author:Frederick J Gravetter, Larry B. WallnauPublisher:Cengage Learning
 Elementary Statistics: Picturing the World (7th E...StatisticsISBN:9780134683416Author:Ron Larson, Betsy FarberPublisher:PEARSON
 The Basic Practice of StatisticsStatisticsISBN:9781319042578Author:David S. Moore, William I. Notz, Michael A. FlignerPublisher:W. H. Freeman
 Introduction to the Practice of StatisticsStatisticsISBN:9781319013387Author:David S. Moore, George P. McCabe, Bruce A. CraigPublisher:W. H. Freeman


