MATLAB: An Introduction with Applications
6th Edition
ISBN: 9781119256830
Author: Amos Gilat
Publisher: John Wiley & Sons Inc
expand_more
expand_more
format_list_bulleted
Question
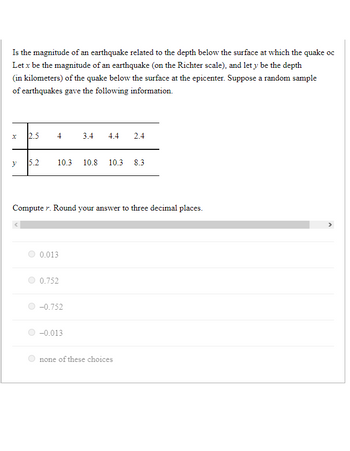
Is the magnitude of an earthquake related to the depth below the surface at which the quake occurs? Let x be the magnitude of an earthquake (on the Richter scale), and let y be the depth (in kilometers) of the quake below the surface at the epicenter. Suppose a random sample of earthquakes gave the following information.
|
x |
2.5 |
4 |
3.4 |
4.4 |
2.4 |
|
y |
5.2 |
10.3 |
10.8 |
10.3 |
8.3 |
Compute r. Round your answer to three decimal places.
0.013
0.752
–0.752
–0.013
none of these choices

Transcribed Image Text:Is the magnitude of an earthquake related to the depth below the surface at which the quake oc
Let x be the magnitude of an earthquake (on the Richter scale), and let y be the depth
(in kilometers) of the quake below the surface at the epicenter. Suppose a random sample
of earthquakes gave the following information.
x
y
2.5
V
5.2
10.3 10.8 10.3 8.3
Computer. Round your answer to three decimal places.
0.013
0.752
3.4 4.4 2.4
-0.752
-0.013
none of these choices
Expert Solution
This question has been solved!
Explore an expertly crafted, step-by-step solution for a thorough understanding of key concepts.
This is a popular solution
Trending nowThis is a popular solution!
Step by stepSolved in 3 steps with 1 images

Knowledge Booster
Similar questions
- Figure 1 shows sample means from samples of size n=100 from a population. Estimate the value of the population parameter and estimate the standard error for the sample statistic. (Please see the picture attached.) μ= SE=arrow_forwardb.arrow_forwardOne of the following is the minimum variance unbiased estimator for u. The sample variance. The sample mean. The sample mean square error. The meadian.arrow_forward
- Below a r bivariate data sets and their scatter plots. (Note that all of the scatter plots are displayed with the same scale.) Each data set is made up of sample values drawn from a population. x y 11- 1- 1.0 1.0 1.0 7.5 10+ 9- 8- 7- 6- 10+ 2.0 8.8 8- 3.0 6.9 2.0 2.0 9- 3.0 3.0 7- 4.0 5.2 5.0 8.4 6.0 4.9 7.0 4.7 8.0 6.8 9.0 6.1 4.0 4.0 6- 5- 5- 5.0 5.0 4- 4- 6.0 6.0 3- 2 3- 7.0 7.0 2 1- 1- 8.0 8.0 9.0 9.0 10.0 10.0 Figure 1 10.0 4.2 Figure 2 1- 1.0 2.6 10- 1.0 6.7 10+ 9- 2.0 9.6 8- 3.0 3.6 2.0 4.5 9- 3.0 3.2 7- 1- 4.0 5.0 4.0 9.2 6- 6- 5- 5- 5.0 4.9 6.0 2.0 7.0 5.6 8.0 9.8 9.0 5.2 10.0 8.2 Figure 4 5.0 4.6 4- 6.0 7.0 7.0 6.0 8.0 7.7 3- 3- 2- 2- 1- 9.0 7.1 10.0 8.4 Figure 3 Answer the following questions about the relationships between pairs of variables and the values of r, the sample correlation coefficient. The same response may be the correct answer for more than one question. (a) For which data set is the sample correlation coefficient r closest to 0? ? Choose one) (b) Which data…arrow_forwardThe population mean mu is a measure of A. Central tendency of a sample B. Central tendency of a populationC. Dispersion of a population D. The uncertainty of a population E. None of the abovearrow_forwardA population of scores has a mean of µ=89, a median of 87 and a mode of 85. What is the most likely shape for the population distribution? Symmetrical Positively skewed Negative skewed It cannot be determined from the information given O Oarrow_forward
arrow_back_ios
arrow_forward_ios
Recommended textbooks for you
 MATLAB: An Introduction with ApplicationsStatisticsISBN:9781119256830Author:Amos GilatPublisher:John Wiley & Sons Inc
 Probability and Statistics for Engineering and th...StatisticsISBN:9781305251809Author:Jay L. DevorePublisher:Cengage Learning
 Statistics for The Behavioral Sciences (MindTap C...StatisticsISBN:9781305504912Author:Frederick J Gravetter, Larry B. WallnauPublisher:Cengage Learning
 Elementary Statistics: Picturing the World (7th E...StatisticsISBN:9780134683416Author:Ron Larson, Betsy FarberPublisher:PEARSON
 The Basic Practice of StatisticsStatisticsISBN:9781319042578Author:David S. Moore, William I. Notz, Michael A. FlignerPublisher:W. H. Freeman
 Introduction to the Practice of StatisticsStatisticsISBN:9781319013387Author:David S. Moore, George P. McCabe, Bruce A. CraigPublisher:W. H. Freeman

MATLAB: An Introduction with Applications
Statistics
ISBN:9781119256830
Author:Amos Gilat
Publisher:John Wiley & Sons Inc

Probability and Statistics for Engineering and th...
Statistics
ISBN:9781305251809
Author:Jay L. Devore
Publisher:Cengage Learning

Statistics for The Behavioral Sciences (MindTap C...
Statistics
ISBN:9781305504912
Author:Frederick J Gravetter, Larry B. Wallnau
Publisher:Cengage Learning

Elementary Statistics: Picturing the World (7th E...
Statistics
ISBN:9780134683416
Author:Ron Larson, Betsy Farber
Publisher:PEARSON

The Basic Practice of Statistics
Statistics
ISBN:9781319042578
Author:David S. Moore, William I. Notz, Michael A. Fligner
Publisher:W. H. Freeman

Introduction to the Practice of Statistics
Statistics
ISBN:9781319013387
Author:David S. Moore, George P. McCabe, Bruce A. Craig
Publisher:W. H. Freeman