
MATLAB: An Introduction with Applications
6th Edition
ISBN: 9781119256830
Author: Amos Gilat
Publisher: John Wiley & Sons Inc
expand_more
expand_more
format_list_bulleted
Related questions
Question
Conduct a t-test at the .01 level.
Find the correct decision about the null hypothesis.
(A) Because the t-statistic exceeds the critical values, we fail to reject the null hypothesis.
(B) Because the t-statistic exceeds the critical values, we reject the null hypothesis.
(C) Because the t-statistic does not exceed the critical values, we fail to reject the null hypothesis.
(D) Because the t-statistic does not exceed the critical values, we reject the null hypothesis.
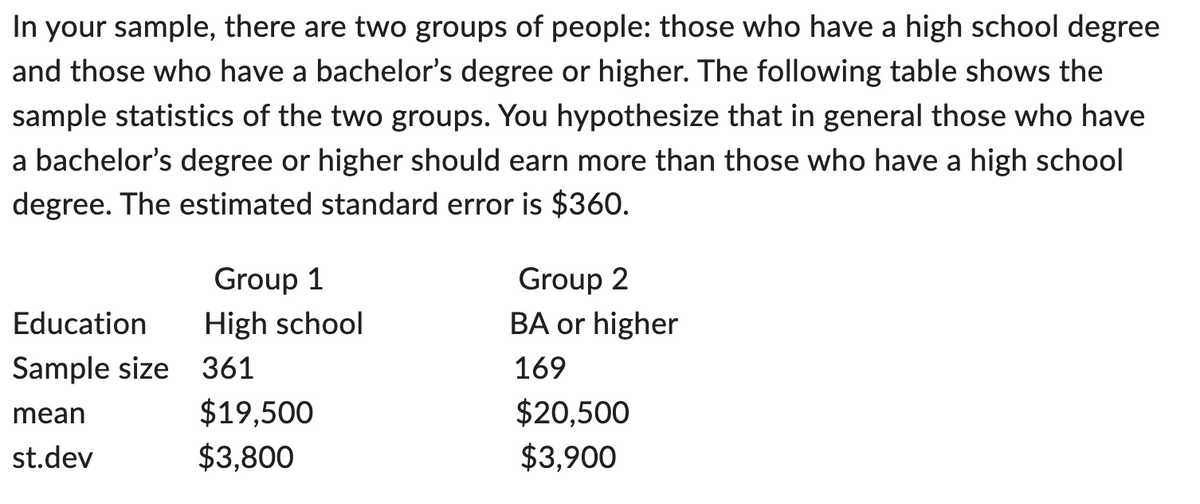

Transcribed Image Text:In your sample, there are two groups of people: those who have a high school degree
and those who have a bachelor's degree or higher. The following table shows the
sample statistics of the two groups. You hypothesize that in general those who have
a bachelor's degree or higher should earn more than those who have a high school
degree. The estimated standard error is $360.
Education
Group 1
High school
Group 2
BA or higher
Sample size
361
mean
$19,500
st.dev
$3,800
169
$20,500
$3,900
Expert Solution
This question has been solved!
Explore an expertly crafted, step-by-step solution for a thorough understanding of key concepts.

Step by stepSolved in 4 steps with 4 images

Knowledge Booster

Similar questions
- 18arrow_forwardA phone company plans on offering their new smartphone in four colours: white, black, silver and rose gold. They anticipate that 30% of shoppers will prefer white, 35% will prefer black, 20% will prefer silver and 15% will prefer rose gold. They perform market research by asking a random sample of 350 potential customers which colour they prefer. Colour Frequency White 104 Chi Square ribution Table Black 127 SAMSUNG Can the company conclude that their expected distribution was accurate using a 1% level of significance? Silver 89 SUBMIT QUESTION Rose Gold ВО SAVE PROGRESS SUBMIT ASSIGNMENT 10:16 Aarrow_forwardA random sample of 100 people was taken. Eighty of the people in the sample favored Candidate A. We are interested in determining whether or not the proportion of the population in favor of Candidate A is significantly more than 75%. Set up a hypothesis test to see if you can find evidence to refute the claim that more than 75% of the residents favor candidate A.arrow_forward
- I need help understanding the null hypothesis and when to “reject” or “fail to reject” it. I got 5.77 in 3df and a critical value of 7.82.arrow_forwardDentists A toothpaste company wants to declare in an ad that more than 80% of dentists recommend their toothpaste. The company performs a hypothesis test at the α = 0.05 significance level to test their claim. The company samples 800 dentists. Of these, 653 recommend their toothpaste. Let p represent the population proportion of dentists that recommend their toothpaste. b.Calculate the z or t statistic. (Do not use continuity correction. Round final answer to 4 decimal places) Statistic: c. Find the p-value. (Do not use continuity correction. Round final answer to 4 decimal places) p-value:arrow_forwardYou may need to use the appropriate echnology to answer this questiol Consider the following hypothesis test. Ha: Hd > 0 (a) The following data are from matched samples taken from two populations. Compute the difference value for each element. (Use Population 1 - Population 2.) Population Element 1 2 Difference 1 21 19 2 28 25 18 17 4 20 17 26 25 (b) Compute d. (c) Compute the standard deviation (d) Conduct a hypothesis test using a = 0.05. Calculate the test statistic. (Round your answer to three decimal places.) Calculate the p-value. (Round your answer to four decimal places.) p-value %3Darrow_forward
- Base on the relationship between the obtained value and the critical value, what decision would you make about the null hypothesis? Reject the null, the critical value exceeds the obtained value Accept the null, the critical value exceeds the obtained value Reject the null, the obtained value exceeds the critical value Accept the null, the obtained value exceeds the critical valuearrow_forwardA personal computer manufacturer is interested in comparing assembly times for two keyboard assembly processes. Assembly times can vary considerably from worker to worker, and the company decides to eliminate this effect by selecting a random sample of 12 workers and timing each worker on each assembly process. Half of the workers are chosen at random to use Process 1 first, and the rest use Process 2 first. For each worker and each process, the assembly time (in minutes) is recorded, as shown in the table below. Worker 1 2 3 4 5 6. 7 8. 9. 10 11 12 Process 1 85 63 46 85 83 70 64 51 48 69 67 52 Process 2 88 46 43 61 80 51 59 53 23 46 59 52 Difference - 3 17 3 24 19 5 -2 25 23 8 (Process 1 - Process 2) Send data to calculator Based on these data, can the company conclude, at the 0.05 level of significance, that the mean assembly times for the two processes differ? Answer this question by performing a hypothesis test regarding u, (which is with a letter "d" subscript), the population…arrow_forwardK During the 2015 season, the home team won 142 of the 263 National Football League games. Is this strong evidence of a home field advantage in professional football? Test an appropriate hypothesis and state your conclusion. Be sure the appropriate assumptions and conditions are satisfied before you proceed. Use α = 0.05. Determine the hypotheses for this test. (The proportion of home teams winning is denoted by p.) Ho: P = HA: P (Type 11 V V # cimals.) …... View an example Statorumaharrow_forward
- P-value is -.055 You are asked to make a decision about whether to reject the null hypothesis that the population value of gamma equals 0 (i.e., that there is no ordinary association in the population between frequency of prayer and health). If alpha = 0.05 and you use a non-directional alternative hypothesis, which of the following is true?) A. Since the p-value is larger than alpha, you do not reject the null hypothesis B. Since the p-value is less than alpha, you do not reject the null hypothesis C. Since the p-value is larger than alpha, you reject the null hypothesis. D. Since the p-value is less than alpha, you reject the null hypothesisarrow_forwardMovie Theater Attendance: The data shown are the movie admissions, in thousands, of people attending movie theaters over two different time periods. At α = 0.05, is there a difference in the means for the movie attendance for these time periods? Use the traditional method of hypothesis testing unless otherwise specified. State the hypotheses and identify the claim. Find the critical value. Compute the test value. Make the decision. Summarize the results. Return of the Jedi (1983) Harry Potter 5 (2007) 6207 10579 4412 4395 6424 6031 8126 6607 8423 5357 7456 2431 4171 2140 3829 1969 3756 1778 5074 2384 6833 2866 5189 2337arrow_forwardA sample mean, sample standard deviation, and sample size are given. Use the one-mean t-test to perform the required hypothesis test about the mean, μ, of the population from which the sample was drawn. Use the critical-value approach. Sample mean = 7.1 s = 2.3 n = 18 α = 0.01 H0: µ = 10 H1: µ < 10 The decision is to the null hypothesis. (Enter R if you reject and enter F if you fail to reject)arrow_forward
arrow_back_ios
SEE MORE QUESTIONS
arrow_forward_ios
Recommended textbooks for you
- MATLAB: An Introduction with ApplicationsStatisticsISBN:9781119256830Author:Amos GilatPublisher:John Wiley & Sons Inc
 Probability and Statistics for Engineering and th...StatisticsISBN:9781305251809Author:Jay L. DevorePublisher:Cengage Learning
 Statistics for The Behavioral Sciences (MindTap C...StatisticsISBN:9781305504912Author:Frederick J Gravetter, Larry B. WallnauPublisher:Cengage Learning
  Elementary Statistics: Picturing the World (7th E...StatisticsISBN:9780134683416Author:Ron Larson, Betsy FarberPublisher:PEARSON
 The Basic Practice of StatisticsStatisticsISBN:9781319042578Author:David S. Moore, William I. Notz, Michael A. FlignerPublisher:W. H. Freeman
 Introduction to the Practice of StatisticsStatisticsISBN:9781319013387Author:David S. Moore, George P. McCabe, Bruce A. CraigPublisher:W. H. Freeman
MATLAB: An Introduction with Applications
Statistics
ISBN:9781119256830
Author:Amos Gilat
Publisher:John Wiley & Sons Inc
Probability and Statistics for Engineering and th...
Statistics
ISBN:9781305251809
Author:Jay L. Devore
Publisher:Cengage Learning
Statistics for The Behavioral Sciences (MindTap C...
Statistics
ISBN:9781305504912
Author:Frederick J Gravetter, Larry B. Wallnau
Publisher:Cengage Learning
Elementary Statistics: Picturing the World (7th E...
Statistics
ISBN:9780134683416
Author:Ron Larson, Betsy Farber
Publisher:PEARSON
The Basic Practice of Statistics
Statistics
ISBN:9781319042578
Author:David S. Moore, William I. Notz, Michael A. Fligner
Publisher:W. H. Freeman
Introduction to the Practice of Statistics
Statistics
ISBN:9781319013387
Author:David S. Moore, George P. McCabe, Bruce A. Craig
Publisher:W. H. Freeman