
MATLAB: An Introduction with Applications
6th Edition
ISBN: 9781119256830
Author: Amos Gilat
Publisher: John Wiley & Sons Inc
expand_more
expand_more
format_list_bulleted
Related questions
Concept explainers
Question
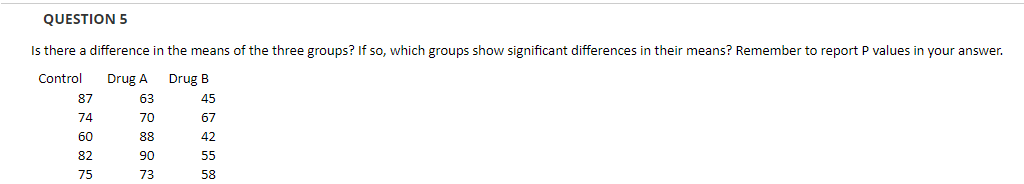

Transcribed Image Text:QUESTION 5
Is there a difference in the means of the three groups? If so, which groups show significant differences in their means? Remember to report P values in your answer.
Control
Drug A
Drug B
87
63
45
74
70
67
60
88
42
82
90
55
75
73
58
Expert Solution
This question has been solved!
Explore an expertly crafted, step-by-step solution for a thorough understanding of key concepts.

Step by stepSolved in 4 steps with 3 images

Knowledge Booster


Learn more about
Need a deep-dive on the concept behind this application? Look no further. Learn more about this topic, statistics and related others by exploring similar questions and additional content below.Similar questions
- The table below contains data from a study of two airlines - Sunshine Airlines & Comfort Airlines - which fly from BWI to Shore City, FL. If one Airline is selected, find P (on time and Comfort Airlines). Number of Flights Arriving on Time Number of Flights Arriving Late Sunshine Airlines 33 5 Comfort Airlines 43 6arrow_forwardAdela Noriegam, a researcher wants to determine how employee salaries at a certain company are related to the length of employment, previous experience, and education. The researcher selects eight employees from the company and obtains the following data: Employee Salary,y Employment (in yrs), x1 Employment (in yrs), x2 Employment (in yrs), x3 A 57310 10 2 16 B 57380 5 6 16 C 54135 4 1 12 D 56985 6 5 14 E 58715 8 8 16 F 60000 20 0 12 G 59400 9 4 18 H 60720 15 7 17 What is the regression equation? Leave your answer in 2 decimal places Y = ()+() +() +arrow_forwarda. Is there a main effect of Drug Dose? Explain. b. Is there a main effect of Sex? Explain. c. Is there an interaction between Sex and Drug Dose? Explain.arrow_forward
- a. Which measure of association would be most appropriate for these variables? b. What is the value of the measure of association? c. What is the strength of the association? d. Would be appropriate to interpret a direction for the association? If so, which direction is the association between the two variables?arrow_forward4. time to try out multiple predictor variables. take a look at the data shown here, where the outcome is becoming a great chef. we suspect that variables such as number of years of experience cooking, level of formal culinary education, and number of different positions (sous chef, pasta station, etc.) all contribute to rankings or scores on the great chef test. a. which are the best predictors of a chef’s score? b. what score can you expect from a person with 12 years of experience and a level 2 education who has held five positions?arrow_forwardi need help with this questionarrow_forward
- C2. Using the information listed below, explore the educational attainment of GSS 2018 respondents. Frequencies and percentages are reported by sex of respondent. a. Calculate the IQR for both groups. What do the IQRS reveal about the degree of diversity for males and females? b. What is the limitation to applying IQR to ordinal data? Highest Educational Degree Males Females Less than high school 63 80 12.9% 12.7% High school graduate 256 296 52.5% 47.1% Junior college 30 72 6.1% 11.4% Bachelor's degree 90 111 18.4% 17.6% Graduate degree 49 70 10% 11.1% 488 629 Total 100% 100% CHAPTER 4 MEASURES Carrow_forwardA foundation asked each person in a representative sample of high school students and in a representative sample of high school teachers which of the rights guaranteed by the First Amendment they thought was the most important. Suppose that the sample size for each sample was 1,000. Data consistent with summary values from the study are summarized in the accompanying table. Students = Teachers Freedom of Speech 658 400 USE SALT Most Important First Amendment Right Freedom of Religion Freedom to Peacefully Assemble Freedom of the Press 30 55 245 420 20 55 Freedom to Petition the Government 47 70 (a) Carry out a hypothesis test to determine if there is convincing evidence that the proportions falling into the five First Amendment rights categories are not the same for teachers and students. Use a significance level of a = 0.01. Calculate the test statistic. (Round your answer to two decimal places.) x²= Use technology to calculate the P-value. (Round your answer to four decimal places.)…arrow_forward
arrow_back_ios
arrow_forward_ios
Recommended textbooks for you
- MATLAB: An Introduction with ApplicationsStatisticsISBN:9781119256830Author:Amos GilatPublisher:John Wiley & Sons Inc
 Probability and Statistics for Engineering and th...StatisticsISBN:9781305251809Author:Jay L. DevorePublisher:Cengage Learning
 Statistics for The Behavioral Sciences (MindTap C...StatisticsISBN:9781305504912Author:Frederick J Gravetter, Larry B. WallnauPublisher:Cengage Learning
  Elementary Statistics: Picturing the World (7th E...StatisticsISBN:9780134683416Author:Ron Larson, Betsy FarberPublisher:PEARSON
 The Basic Practice of StatisticsStatisticsISBN:9781319042578Author:David S. Moore, William I. Notz, Michael A. FlignerPublisher:W. H. Freeman
 Introduction to the Practice of StatisticsStatisticsISBN:9781319013387Author:David S. Moore, George P. McCabe, Bruce A. CraigPublisher:W. H. Freeman
MATLAB: An Introduction with Applications
Statistics
ISBN:9781119256830
Author:Amos Gilat
Publisher:John Wiley & Sons Inc
Probability and Statistics for Engineering and th...
Statistics
ISBN:9781305251809
Author:Jay L. Devore
Publisher:Cengage Learning
Statistics for The Behavioral Sciences (MindTap C...
Statistics
ISBN:9781305504912
Author:Frederick J Gravetter, Larry B. Wallnau
Publisher:Cengage Learning
Elementary Statistics: Picturing the World (7th E...
Statistics
ISBN:9780134683416
Author:Ron Larson, Betsy Farber
Publisher:PEARSON
The Basic Practice of Statistics
Statistics
ISBN:9781319042578
Author:David S. Moore, William I. Notz, Michael A. Fligner
Publisher:W. H. Freeman
Introduction to the Practice of Statistics
Statistics
ISBN:9781319013387
Author:David S. Moore, George P. McCabe, Bruce A. Craig
Publisher:W. H. Freeman