
A First Course in Probability (10th Edition)
10th Edition
ISBN: 9780134753119
Author: Sheldon Ross
Publisher: PEARSON
expand_more
expand_more
format_list_bulleted
Related questions
Question

Transcribed Image Text:**Title: Analysis of Racial Distribution in Work-Study Programs**
**Introduction:**
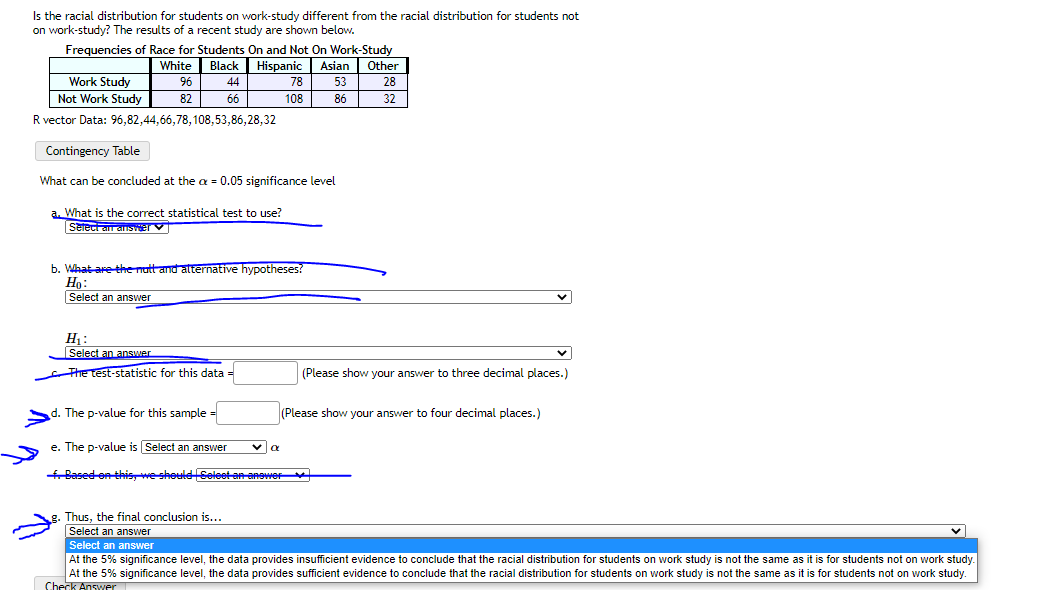
This document explores whether the racial distribution for students on work-study differs from those not on work-study, utilizing statistical analysis at a 0.05 significance level.
**Data Overview:**
- **Contingency Table:**
| | White | Black | Hispanic | Asian | Other |
|------------------------|-------|-------|----------|-------|-------|
| Work Study | 96 | 44 | 78 | 53 | 28 |
| Not Work Study | 82 | 66 | 108 | 86 | 32 |
- **R Vector Data:** 96, 82, 44, 66, 78, 108, 53, 86, 28, 32
**Analysis Steps:**
1. **Statistical Test Selection:**
- **a.** Choose the correct test for analyzing the data.
2. **Hypotheses Formation:**
- **b.** Define the null hypothesis (\(H_0\)) and the alternative hypothesis (\(H_1\)).
3. **Calculation of Test Statistic:**
- **c.** Compute the test-statistic and report the value to three decimal places.
4. **Determination of P-Value:**
- **d.** Calculate and present the p-value to four decimal places.
5. **Comparison of P-Value and Significance Level:**
- **e.** Assess if the p-value is less than or equal to \(\alpha\).
6. **Decision Making:**
- **f.** Based on the comparison, make a decision to reject or fail to reject the null hypothesis.
7. **Conclusion:**
- **g.** Draw an overall conclusion:
- Option 1: At the 5% significance level, there is insufficient evidence to conclude a difference in racial distribution.
- Option 2: At the 5% significance level, there is sufficient evidence to conclude a difference in racial distribution.
**Conclusion:**
This guide will help assess whether there is a significant difference in the racial distribution between students involved in work-study programs and those who are not. Decisions are made based on the computed statistical analyses and relevant hypothesis testing results.
Expert Solution
This question has been solved!
Explore an expertly crafted, step-by-step solution for a thorough understanding of key concepts.

This is a popular solution

Trending nowThis is a popular solution!

Step by stepSolved in 4 steps with 4 images

Knowledge Booster

Similar questions
- I need help with something regarding this problem. The National Sleep Foundation recommends that adults aged 18 to 64 get an average of 8 hours of sleep per night. A survey of sleep hours was taken during a Statistics class. The data is listed below: 4, 5, 5, 5, 5.5, 6, 6, 6, 6, 7, 7, 7, 7, 7, 7, 7, 8, 8, 8, 8, 9, 9, 9, 10, 10 Do we have enough evidence at the 0.05 significance level to say that statistics students tend to get less sleep than the recommended average of 8 hours per night? How would I get the degrees of freedom?arrow_forwardSuppose the National Transportation Safety Board (NTSB) wants to examine the safety of compact cars, midsize cars, and full-size cars. It collects a sample of cars each of the cars types. The data below displays the frontal crash test performance percentages. Test whether there are statistical differences in the frontal crash test performance for each type of car. Car Sizes Compact Cars Midsize Cars Full-Size Cars 95 95 93 98 98 97 87 98 92 99 89 92 99 94 84 94 88 87 99 93 88 98 99 89 What conclusions can we draw from the follow-up t-tests? There is/are a total of ______ statistically significant difference(s) between car type pairs out of the follow-up t-tests. Options: a) 1 b) 2 c) 3 d) 4 e) 5 f) 6arrow_forwardNumber of Frogs Caught Daily Next to my House 29 23 14 13 23 22 16 24 27 25 26 19 21 19 25 what's the mode of the data set?arrow_forward
- Speak Calculate the mode, mean, and median of the following data: 19, 16, 16, 10, 999, 14, 16, 919, 16, 16, 10, 999, 14, 16, 9 Which measure of center does not work well here?A. MedianB. ModeC. MeanD. All of the abovearrow_forwardIn the data set below, the frequency of is 5, 7, 1, 12, 17, 5, 1, 7, 10, 5 5 3 --- 12 15 1 3 10arrow_forwardFind the mean, median, and mode for the given set of ungrouped data. 3, 3, 3, 3, 4, 4, 5, 5, 5, 5 mean = median = Identify the mode(s). O 1,2 O 3,5 1,3 O 2,5 ооarrow_forward
arrow_back_ios
arrow_forward_ios
Recommended textbooks for you
- A First Course in Probability (10th Edition)ProbabilityISBN:9780134753119Author:Sheldon RossPublisher:PEARSON

A First Course in Probability (10th Edition)
Probability
ISBN:9780134753119
Author:Sheldon Ross
Publisher:PEARSON