Is the mean length of adult invasive Lionfish in the Atlantic coast of South Carolina greater than 355.6mm? (don't answer this, this is just so you know what the data is for) Answer the following questions and use the provided excel images, data on the far left is lionfish data Question 1. Describe your null and alternative hypotheses in words. Question 2. Describe your null and alternative hypotheses using symbols. Question 3. Select the significance level (a). Question 4. Select an appropriate test, calculate the test statistic and p-value using Excel. Test statistic: P-value: Question 5. Determine whether you should reject or not reject the null hypothesis based on the p-value. State the reason to support your answer. Question 6. Describe your conclusion in words in the context of your research question.
Is the mean length of adult invasive Lionfish in the Atlantic coast of South Carolina greater than 355.6mm? (don't answer this, this is just so you know what the data is for) Answer the following questions and use the provided excel images, data on the far left is lionfish data Question 1. Describe your null and alternative hypotheses in words. Question 2. Describe your null and alternative hypotheses using symbols. Question 3. Select the significance level (a). Question 4. Select an appropriate test, calculate the test statistic and p-value using Excel. Test statistic: P-value: Question 5. Determine whether you should reject or not reject the null hypothesis based on the p-value. State the reason to support your answer. Question 6. Describe your conclusion in words in the context of your research question.

Glencoe Algebra 1, Student Edition, 9780079039897, 0079039898, 2018
18th Edition
ISBN:9780079039897
Author:Carter
Publisher:Carter
Chapter10: Statistics
Section10.3: Measures Of Spread
Problem 1GP

Related questions
Question
100%
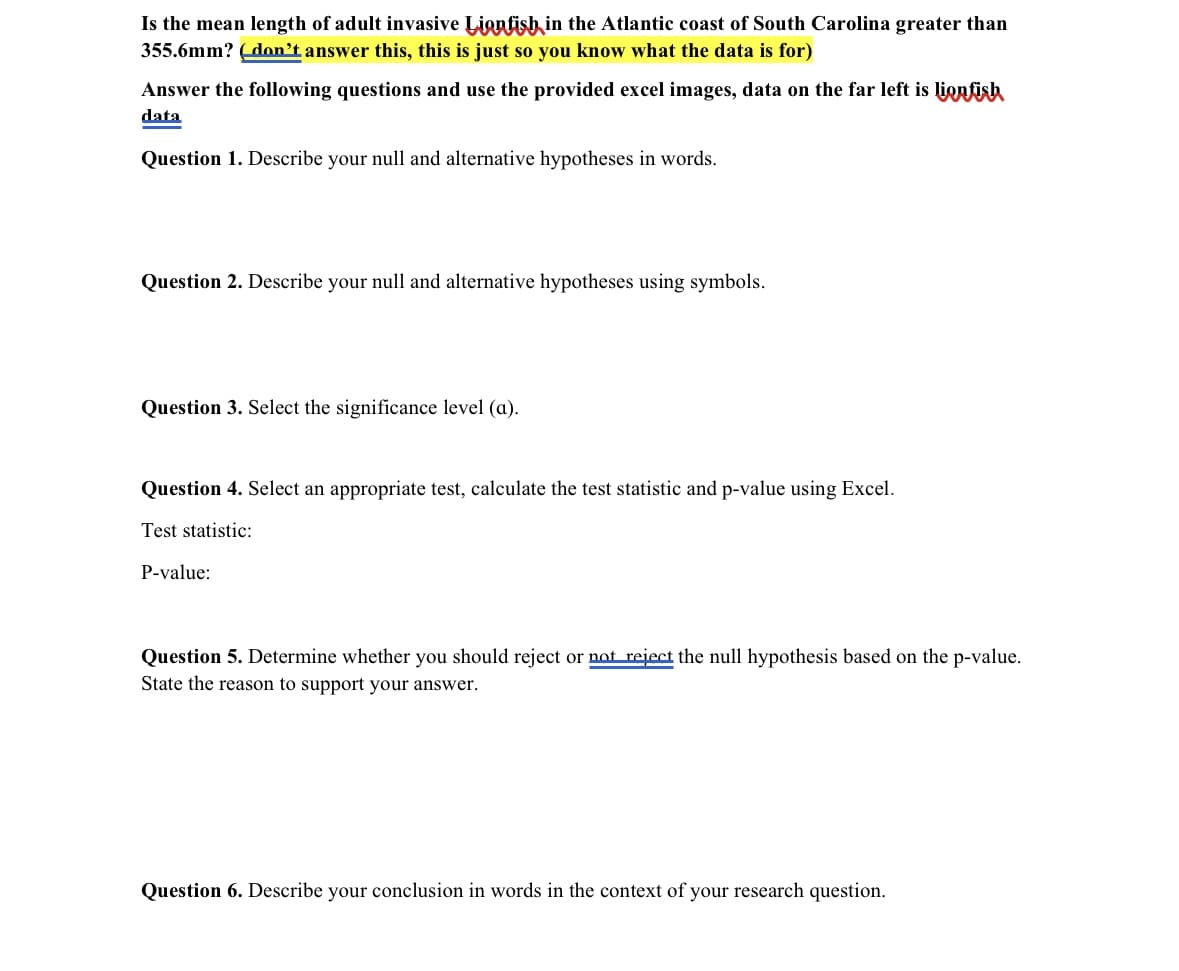
Transcribed Image Text:Is the mean length of adult invasive Lionfish in the Atlantic coast of South Carolina greater than
355.6mm? (don't answer this, this is just so you know what the data is for)
Answer the following questions and use the provided excel images, data on the far left is lionfish
data
Question 1. Describe your null and alternative hypotheses in words.
Question 2. Describe your null and alternative hypotheses using symbols.
Question 3. Select the significance level (a).
Question 4. Select an appropriate test, calculate the test statistic and p-value using Excel.
Test statistic:
P-value:
Question 5. Determine whether you should reject or not reject the null hypothesis based on the p-value.
State the reason to support your answer.
Question 6. Describe your conclusion in words in the context of your research question.
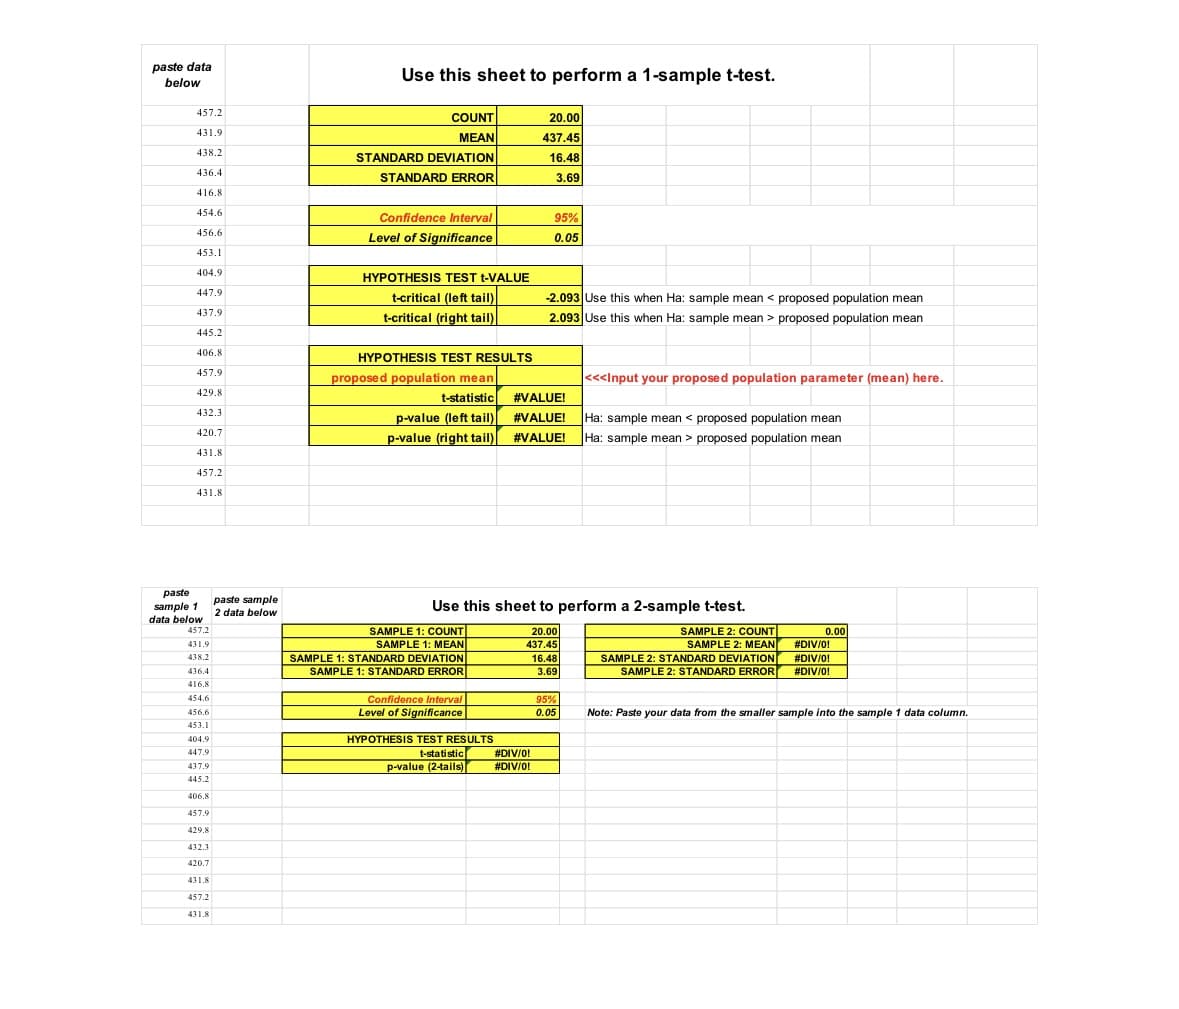
Transcribed Image Text:paste data
below
457.2
Use this sheet to perform a 1-sample t-test.
COUNT
20.00
431.9
MEAN
437.45
438.2
STANDARD DEVIATION
16.48
436.4
STANDARD ERROR
3.69
416.8
454.6
Confidence Interval
456.6
Level of Significance
95%
0.05
453.1
404.9
447.9
437.9
445.2
406.8
457.9
429.8
432.3
420.7
HYPOTHESIS TEST t-VALUE
t-critical (left tail)
t-critical (right tail)
HYPOTHESIS TEST RESULTS
proposed population mean
-2.093 Use this when Ha: sample mean <proposed population mean
2.093 Use this when Ha: sample mean > proposed population mean
t-statistic #VALUE!
p-value (left tail)[ #VALUE!
p-value (right tail) #VALUE!
<<<Input your proposed population parameter (mean) here.
Ha: sample mean <proposed population mean
Ha: sample mean > proposed population mean
431.8
457.2
431.8
paste
sample 1
data below
paste sample
2 data below
457.2
431.9
438.2
436.4
416.8
454.6
456.6
453.1
404.9
447.9
437.9
445.2
406.8
457.9
429.8
432.3
420.7
431.8
457.2
431.8
Use this sheet to perform a 2-sample t-test.
SAMPLE 1: COUNT
SAMPLE 1: MEAN
20.00
437.45
SAMPLE 2: COUNT
SAMPLE 2: MEAN
0.00
#DIV/0!
SAMPLE 1: STANDARD DEVIATION
SAMPLE 1: STANDARD ERROR
16.48
SAMPLE 2: STANDARD DEVIATION
#DIV/0!
3.69
SAMPLE 2: STANDARD ERROR
#DIV/0!
Confidence Interval
Level of Significance
HYPOTHESIS TEST RESULTS
t-statistic
p-value (2-tails)
95%
0.05
Note: Paste your data from the smaller sample into the sample 1 data column.
#DIV/0!
#DIV/0!
Expert Solution
This question has been solved!
Explore an expertly crafted, step-by-step solution for a thorough understanding of key concepts.

This is a popular solution!

Trending now
This is a popular solution!

Step by step
Solved in 5 steps with 5 images

Recommended textbooks for you
Glencoe Algebra 1, Student Edition, 9780079039897…
Algebra
ISBN:
9780079039897
Author:
Carter
Publisher:
McGraw Hill
Glencoe Algebra 1, Student Edition, 9780079039897…
Algebra
ISBN:
9780079039897
Author:
Carter
Publisher:
McGraw Hill