
MATLAB: An Introduction with Applications
6th Edition
ISBN: 9781119256830
Author: Amos Gilat
Publisher: John Wiley & Sons Inc
expand_more
expand_more
format_list_bulleted
Related questions
Question
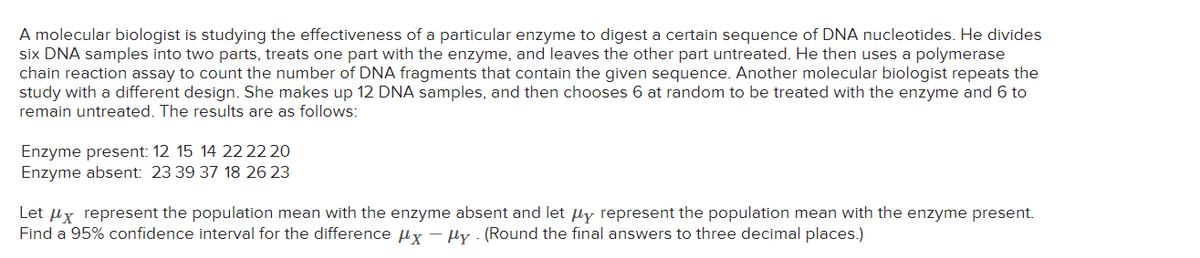

Transcribed Image Text:A molecular biologist is studying the effectiveness of a particular enzyme to digest a certain sequence of DNA nucleotides. He divides
six DNA samples into two parts, treats one part with the enzyme, and leaves the other part untreated. He then uses a polymerase
chain reaction assay to count the number of DNA fragments that contain the given sequence. Another molecular biologist repeats the
study with a different design. She makes up 12 DNA samples, and then chooses 6 at random to be treated with the enzyme and 6 to
remain untreated. The results are as follows:
Enzyme present: 12 15 14 22 22 20
Enzyme absent: 23 39 37 18 26 23
Let μx represent the population mean with the enzyme absent and let μy represent the population mean with the enzyme present.
Find a 95% confidence interval for the difference μ✗- μy (Round the final answers to three decimal places.)
Expert Solution
This question has been solved!
Explore an expertly crafted, step-by-step solution for a thorough understanding of key concepts.

This is a popular solution

Trending nowThis is a popular solution!

Step by stepSolved in 3 steps with 8 images

Knowledge Booster

Similar questions
- A random selection of volunteers at a research institute have been exposed to a typical cold virus. After they started to have cold symptoms, 10 of them were given multivitamin tablets formulated to fight cold symptoms. The remaining 10 volunteers were given placebo tablets. For each individual, the length of time taken to recover from the cold is recorded. At the end of the experiment the following data are obtained. Days to recover from a cold Treated with multivitamin 2.6, 5.9, 5.3, 5.8, 8.7, 6.2, 7.6, 6.4, 8.0, 4.0 Treated with placebo 3.0, 5.1, 4.7, 4.2, 4.7, 5.6, 5.9, 4.7, 7.1, 4.9 It is known that the population standard deviation of recovery time from a cold is 1.8 days when treated with multivitamin tablets, and the population standard deviation of recovery time from a cold is 1.5 days when treated with placebo tablets. It is also known that both populations are approximately normally distributed. The researchers claim that the mean recovery time, l, of the patients treated…arrow_forwardA doctor released the results of clinical trials for a vaccine to prevent a particular disease. In these clinical trials, 400,000 children were randomly divided in two groups. The subjects in group 1 (the experimental group) were given the vaccine, while the subjects in group 2 (the control group) were given a placebo. Of the 200,000 children in the experimental group, 41 developed the disease. Of the 200,000 children in the control group, 109 developed the disease. Complete parts (a) through (f) below. (d) What is a placebo? OA. An innocuous medication OB. Whatever does the opposite of the actual medication OC. A pill OD. Water (e) Why is such a large number of subjects needed for this study? OA. The number of subjects is so large because the vaccine is very effective. OB. The number of subjects is so large because a large sample size is needed to ensure that the samples are independent. OC. The number of subjects is so large because these are clinical trials, which require a…arrow_forwardA molecular biologist is studying the effectiveness of a particular enzyme to digest a certain sequence of DNA nucleotides. He divides six DNA samples into two parts, treats one part with the enzyme, and leaves the other part untreated. He then uses a polymerase chain reaction assay to count the number of DNA fragments that contain the given sequence. The results are as follows: 2 Sample 5 3 4 Enzyme present Enzyme absent 16 11 22 34 14 43 30 12 40 16 27 10 Find a 95% confidence interval for the difference between the mean numbers of fragments.arrow_forward
- Bonnie and her friends are dubious that a new abdominal exercise machine is as effective as its commercial claims. They decide to conduct an experiment to find out. For three months, Bonnie has 25 randomly chosen friends use the new machine, and 25 others do traditional abdominal exercises. At the end of the experiment, she counts the number of sit-ups each friend can do in one minute. No. of sit-ups for friends who use machine 43 29 41 22 43 28 35 26 31 48 41 24 48 25 23 35 25 28 28 31 27 45 41 22 46 Mean: 33.4 sit-ups No. of sit-ups for friends who do traditional exercises 44 33 33 24 49 39 21 45 44 48 47 50 43 46 29 46 45 32 36 41 49 45 28 49 29 Mean: 39.8 sit-ups How much lower is the average for the treatment group than the average for the control group? sit-upsarrow_forwardA study of fox rabies in a country gave the following information about different regions and the occurrence of rabies in each region. A random sample of n1 = 16 locations in region I gave the following information about the number of cases of fox rabies near that location. x1: Region I Data 2 8 8 8 6 8 8 1 3 3 3 2 5 1 4 6 A second random sample of n2 = 15 locations in region II gave the following information about the number of cases of fox rabies near that location. x2: Region II Data 1 1 5 1 4 8 5 4 4 4 2 2 5 6 9 (i) Use a calculator with sample mean and sample standard deviation keys to calculate x1 and s1 in region I, and x2 and s2 in region II. (Round your answers to two decimal places.) x1 = s1 = x2 = s2 = (ii) Does this information indicate that there is a difference (either way) in the mean number of cases of fox rabies between the two regions? Use a 5% level of significance. (Assume the distribution of rabies cases in both regions is…arrow_forwardIn a study of chromosomal anomalies observed in a randomly selected sample of 1200 infertile men with either a zero or low sperm count, a team of researchers assigned the value of 1 for the presence of any chromosomal anomaly in the subject's sperm and the value of 0 for the absence of all chromosomal anomalies in the subject's sperm.Of the 600 men with zero sperm count, 48 had chromosomal anomalies. Of the 600 men with low sperm count, 15 had chromosomal anomalies. The researchers would like to test the hypothesesHo: P1 = P2Ha: P1 does not equal P2where p₁ the true proportion of all men with zero sperm count that have chromosomal anomalies and p₂ = the true proportion of all men with low sperm count that have chromosomal anomalies.What is the z standardized test statistic, for this test?arrow_forward
- A study of fox rabies in southern Germany gave the following information about different regions and the occurrence of rabies in each region. A random sample of n1 = 16 locations in region 1 gave the following information about the number of cases of fox rabies near that location. x1: Region I Data 3 7 8 7 5 8 8 1 3 3 3 2 5 1 4 6 A second random sample of n2 = 15 locations in region II gave the following information about the number of cases of fox rabies near that location. x2: Region II Data 4 2 4 1 3 8 5 4 4 4 2 2 5 6 9 Note: If a two-sample t-test is appropriate, for degrees of freedom d.f. not in the Student's t table, use the closest d.f. that is smaller. In some situations, this choice of d.f. may increase the P-value by a small amount and therefore produce a slightly more "conservative" answer.Use a calculator with sample mean and sample standard deviation keys to find x1 and s1 in region I, and x2 and s2 in region II. (Round your answers to two…arrow_forwardA dairy farmer thinks that the average weight gain of his cows depends on two factors: the type of grain that they are fed and the type of grass that they are fed. The dairy farmer has four different types of grain from which to choose and three different types of grass from which to choose. He would like to determine if there is a particular combination of grain and grass that would lead to the greatest weight gain on average for his cows. He randomly selects three one-year-old cows and assigns them to each of the possible combinations of grain and grass. After one year he records the weight gain for each cow (in pounds) with the following results. Is there sufficient evidence to conclude that there is a significant difference in the average weight gains among the cows for the different types of grain? Cow Weight Gain (Pounds) Grass A Grass B Grass B Grain A 359359 327327 232232 277277 250250 163163 191191 304304 216216 Grain B 331331 348348 176176 318318 205205…arrow_forwardOne year at a university, the algebra course director decided to experiment with a new teaching method that might reduce variability in final-exam scores by eliminating lower scores. The director randomly divided the algebra students who were registered for class at 9:40 A.M. into two groups. One of the groups, called the control group, was taught the usual algebra course; the other group, called the experimental group, was taught by the new teaching method. Both classes covered the same material, took the same unit quizzes, and took the same final exam at the same time. The final-exam scores (out of 40 possible) for the two groups are shown in the accompanying table. Find a 99% confidence interval for the ratio of the population standard deviations of final-exam scores for students taught by the conventional method and for students taught by the new method. Assume that both populations are normally distributed. (Note: s₁ = 6.613, $₂ = 5.762, and for df = (19,40), F0.005 = 2.63.) Click…arrow_forward
- A study of fox rabies in a country gave the following information about different regions and the occurrence of rabies in each region. A random sample of n1 = 16 locations in region I gave the following information about the number of cases of fox rabies near that location. x1: Region I Data 1 9 9 9 7 8 8 1 3 3 3 2 5 1 4 6 A second random sample of n2 = 15 locations in region II gave the following information about the number of cases of fox rabies near that location. x2: Region II Data 1 1 5 1 6 8 5 4 4 4 2 2 5 6 9 What is the value of the sample test statistic? (Test the difference μ1 − μ2. Do not use rounded values. Round your final answer to three decimal places.)arrow_forwardOn each trial of an experiment, a subject is presented with a constant soft noise, which is interrupted at some unpredictable time by a noticeably louder sound. The time it takes for the subject to react to this louder sound is recorded. The following list contains the reaction times (in milliseconds) for the 15 trials of this experiment: 212, 236, 217, 235, 164, 257, 175, 285, 202, 193, 231,152, 269, 296, 186 Send data to calculator Find 30th and 75th percentiles for these reaction times.arrow_forwardA random selection of volunteers at a research institute have been exposed to a typical cold virus. After they started to have cold symptoms, 15 of them were given multivitamin tablets formulated to fight cold symptoms. The remaining 15 volunteers were given placebo tablets. For each individual, the length of time taken to recover from the cold is recorded. At the end of the experiment the following data are obtained. Days to recover from a cold Treated with multivitamin 4.9. 3.9, 4.9. 7.3, 3.7, 5.7, 4.3, 6.1, 4.9, 5.4, 7.7, 7.3, 4.6, 4.3, 4.6 Treated with placebo 5.1, 5.3, 5.3, 1.6, 1.6, 4.8, 4.4, 3.3, 3.7, 5.2, 5.5, 5.8, 6.5, 1.5, 5.4 Send data to calculator Send data to Excel It is known that the population standard deviation of recovery time from a cold is 1.8 days when treated with multivitamin tablets, and the population standard deviation of recovery time from a cold is 1.5 days when treated with placebo tablets. It is also known that both populations are approximately normally…arrow_forward
arrow_back_ios
SEE MORE QUESTIONS
arrow_forward_ios
Recommended textbooks for you
- MATLAB: An Introduction with ApplicationsStatisticsISBN:9781119256830Author:Amos GilatPublisher:John Wiley & Sons Inc
 Probability and Statistics for Engineering and th...StatisticsISBN:9781305251809Author:Jay L. DevorePublisher:Cengage Learning
 Statistics for The Behavioral Sciences (MindTap C...StatisticsISBN:9781305504912Author:Frederick J Gravetter, Larry B. WallnauPublisher:Cengage Learning
  Elementary Statistics: Picturing the World (7th E...StatisticsISBN:9780134683416Author:Ron Larson, Betsy FarberPublisher:PEARSON
 The Basic Practice of StatisticsStatisticsISBN:9781319042578Author:David S. Moore, William I. Notz, Michael A. FlignerPublisher:W. H. Freeman
 Introduction to the Practice of StatisticsStatisticsISBN:9781319013387Author:David S. Moore, George P. McCabe, Bruce A. CraigPublisher:W. H. Freeman
MATLAB: An Introduction with Applications
Statistics
ISBN:9781119256830
Author:Amos Gilat
Publisher:John Wiley & Sons Inc
Probability and Statistics for Engineering and th...
Statistics
ISBN:9781305251809
Author:Jay L. Devore
Publisher:Cengage Learning
Statistics for The Behavioral Sciences (MindTap C...
Statistics
ISBN:9781305504912
Author:Frederick J Gravetter, Larry B. Wallnau
Publisher:Cengage Learning
Elementary Statistics: Picturing the World (7th E...
Statistics
ISBN:9780134683416
Author:Ron Larson, Betsy Farber
Publisher:PEARSON
The Basic Practice of Statistics
Statistics
ISBN:9781319042578
Author:David S. Moore, William I. Notz, Michael A. Fligner
Publisher:W. H. Freeman
Introduction to the Practice of Statistics
Statistics
ISBN:9781319013387
Author:David S. Moore, George P. McCabe, Bruce A. Craig
Publisher:W. H. Freeman