
MATLAB: An Introduction with Applications
6th Edition
ISBN: 9781119256830
Author: Amos Gilat
Publisher: John Wiley & Sons Inc
expand_more
expand_more
format_list_bulleted
Related questions
Question
Interpret the graph shown in the image associated with the averages shown in the table.
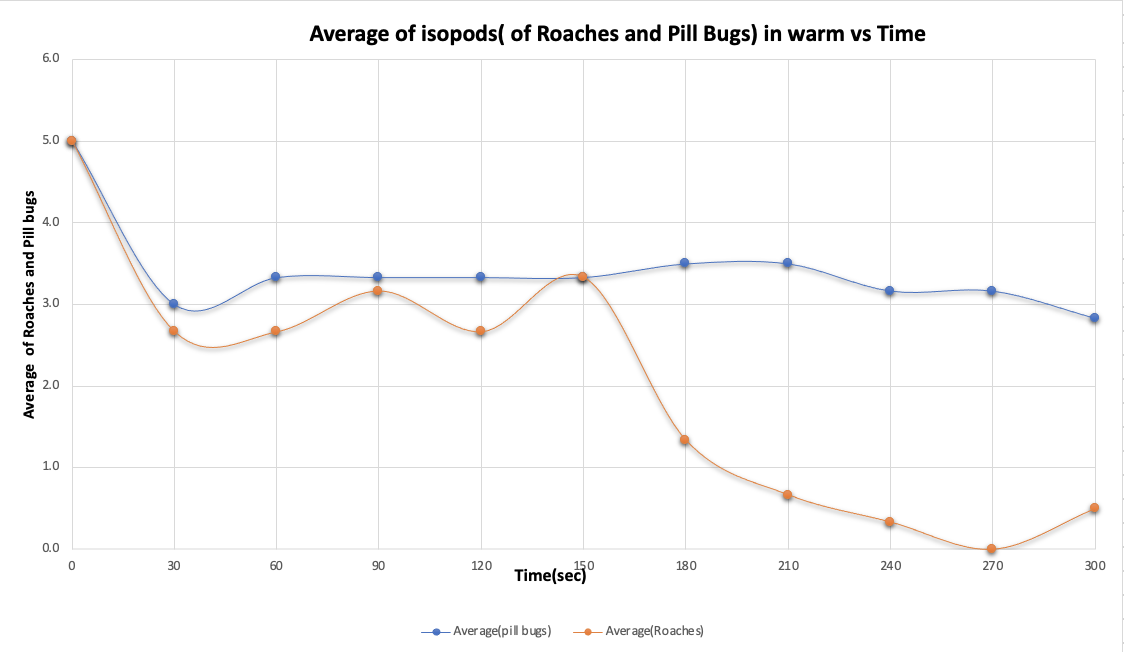

Transcribed Image Text:Average of isopods( of Roaches and Pill Bugs) in warm vs Time
6.0
5.0
4.0
3.0
2.0
1.0
0.0
30
60
90
120
180
210
240
270
300
Time(seč)
Aver age(pill bugs)
Aver age(Roaches)
Average of Roaches and Pill bugs

Transcribed Image Text:Trial 1
Trail 2
Trial 3
Trial 1
Trial 2
Trial 3
Time
Temperature(Warm) Temperature(Warm)
Temperature(Warm)
Average (pill bugs in warm)
Temperature (Warm) Temperature(Warm) Temperature(Warm) Average(roaches in warm)
0:00
5
5.0
5
5
5
5.0
0:30
3
3
3
3.0
4
4
2.7
1:00
4
3
3.3
4
4
2.7
1:30
3
4
3
3.3
0.5
4
5
3.2
2:00
3
4
3.3
2
4
2.7
2:30
3
4
3
3.3
1
5
4
3.3
3:00
3
4
3.5
3.5
1
3
1.3
3:30
3
4
3.5
3.5
1
1
0.7
4:00
3.5
3
3
3.2
1
0.3
4:30
2.5
3
4
3.2
0.0
5:00
2.5
3
2.8
0.5
1
0.5
O N
Expert Solution
This question has been solved!
Explore an expertly crafted, step-by-step solution for a thorough understanding of key concepts.

Step by stepSolved in 2 steps with 1 images

Knowledge Booster

Similar questions
- Nicole has a popular blog about cooking and nutrition and regularly posts articles and videos. She has collected data about the length of time that viewers spent watching two of her recent videos. For each video, she recorded the amount of time (in minutes) that each of 102 viewers spent watching it. The histograms below show the distributions of the two data sets. Each histogram shows time (in minutes) on the horizontal axis and the number of viewers on the vertical axis. The means and standard deviations for the data sets are also given. Video 1 Video 2 25- 25- 20- 20- 15- 15- 10- 10- 5- 5- 0- 19.5 24.5 29.5 34.5 39.5 44.5 49.5 54.5 59.5 64.5 69.5 19.5 24.5 29.5 34.5 39.5 44.5 49.5 54.5 59.5 64.5 69.5 Video 1 mean: 52.05 minutes Video 2 mean: 44.25 minutes Video 1 standard deviation: 12.54 minutes Video 2 standard deviation: 8.16 minutes Nicole wants to use the Empirical Rule to make some approximations about both data sets. Unfortunately, it is appropriate to use the Empirical Rule…arrow_forwardA sports columnist wishes to portray baseball players as overpaid. Which measure of center should he report as the representative salary of major league players. the mean the median either mean or the median since they will be equal neither the mean nor the median, since both will be much lower than the actual average salaryarrow_forwardA back-to-back stem-and-leaf plot compares two data sets by using the same stems for each data set. Leaves for the first data set are on one side while leaves for the second data set are on the other side. The back-to-back stem- and-leaf plot available below shows the salaries (in thousands) of all lawyers at two small law firms. Complete parts (a) and (b) below. Click the icon to view the back-to-back stem-and-leaf plot. (a) What are the lowest and highest salaries at Law Firm A? at Law Firm B? How many lawyers are in each firm? At Law Firm A the lowest salary was $ At Law Firm B the lowest salary was $ and the highest salary was $ and the highest salary was $arrow_forward
- A set of data has a histogram that is extremely skewed, what does this tell you about the data and how observations will tend to fall around the mean?arrow_forwardThe mean is a better measure of location when there are no outliers. True Falsearrow_forwardFind the percentage of data that lies below -2.40, above 1.73, and between -2.40 and 1.73arrow_forward
- For data on "volumes of milk dispensed into 2-gallon milk cartons," should you use the mean or the median to describe the center?arrow_forwardAccording to a business report, The mean age of a staff of statistics department is 18.25 years. Some new people with a mean age of 16 years join the department,now the mean age of the department becomes 17 years. Find the number of new people who join the statistics department.arrow_forward
arrow_back_ios
arrow_forward_ios
Recommended textbooks for you
- MATLAB: An Introduction with ApplicationsStatisticsISBN:9781119256830Author:Amos GilatPublisher:John Wiley & Sons Inc
 Probability and Statistics for Engineering and th...StatisticsISBN:9781305251809Author:Jay L. DevorePublisher:Cengage Learning
 Statistics for The Behavioral Sciences (MindTap C...StatisticsISBN:9781305504912Author:Frederick J Gravetter, Larry B. WallnauPublisher:Cengage Learning
  Elementary Statistics: Picturing the World (7th E...StatisticsISBN:9780134683416Author:Ron Larson, Betsy FarberPublisher:PEARSON
 The Basic Practice of StatisticsStatisticsISBN:9781319042578Author:David S. Moore, William I. Notz, Michael A. FlignerPublisher:W. H. Freeman
 Introduction to the Practice of StatisticsStatisticsISBN:9781319013387Author:David S. Moore, George P. McCabe, Bruce A. CraigPublisher:W. H. Freeman
MATLAB: An Introduction with Applications
Statistics
ISBN:9781119256830
Author:Amos Gilat
Publisher:John Wiley & Sons Inc
Probability and Statistics for Engineering and th...
Statistics
ISBN:9781305251809
Author:Jay L. Devore
Publisher:Cengage Learning
Statistics for The Behavioral Sciences (MindTap C...
Statistics
ISBN:9781305504912
Author:Frederick J Gravetter, Larry B. Wallnau
Publisher:Cengage Learning
Elementary Statistics: Picturing the World (7th E...
Statistics
ISBN:9780134683416
Author:Ron Larson, Betsy Farber
Publisher:PEARSON
The Basic Practice of Statistics
Statistics
ISBN:9781319042578
Author:David S. Moore, William I. Notz, Michael A. Fligner
Publisher:W. H. Freeman
Introduction to the Practice of Statistics
Statistics
ISBN:9781319013387
Author:David S. Moore, George P. McCabe, Bruce A. Craig
Publisher:W. H. Freeman