FINANCIAL ACCOUNTING
10th Edition
ISBN: 9781259964947
Author: Libby
Publisher: MCG
expand_more
expand_more
format_list_bulleted
Question
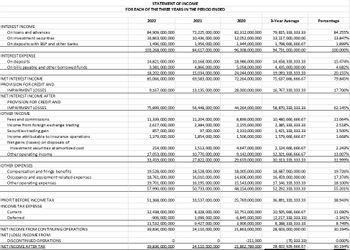
S.e.e. .t.h.e. .a.t.t.a.c.h. .p.i.c.t.u.r.e. .b.e.l.o.w. .a.n.d. .E.x.p.l.a.i.n. .t.h.e. .s.t.a.t.e.m.e.n.t. .o.f. i.n.c.o.m.e. .b.e.l.o.w.

Transcribed Image Text:INTEREST INCOME
On loans and advances
On investment securities
On deposits with BSP and other banks
INTEREST EXPENSE
On deposits
On bills payable and other borrowed funds
NET INTEREST INCOME
PROVISION FOR CREDIT AND
IMPAIRMENT LOSSES
NET INTEREST INCOME AFTER
PROVISION FOR CREDIT AND
IMPAIRMENT LOSSES
OTHER INCOME
Fees and commissions
yees and com
Income from foreign exchange trading
Securities trading gain
Income attributable to insurance operations
Netgains (losses) on disposals of
investment securities at amortized cost
Other operating income
OTHER EXPENSES
Compensation and fringe benefits
Occupancy and equipment-related expenses
Other operating expenses
PROFIT BEFORE INCOME TAX
INCOME TAX EXPENSE
Current
Deferred
NET INCOME FROM CONTINUING OPERATIONS
NET (LOSS) INCOME FROM
DISCONTINUED OPERATIONS
NET INCOME AFTER TAX
STATEMENT OF INCOME
FOR EACH OF THE THREE YEARS IN THE PERIOD ENDED
2022
84,909,000,000
16,863,000,000
1,496,000,000
103,268,000,000
14,821,000,000
3,381,000,000
18,202,000,000
85,066,000,000
9,167,000,000
75,899,000,000
11,339,000,000
2,617,000,000
857,000,000
1,379,000,000
214,000,000
17,053,000,000
33,459,000,000
19,528,000,000
18,761,000,000
19,701,000,000
57,990,000,000
51,368,000,000
12,438,000,000
-906,000,000
11,532,000,000
39,836,000,000
0
39,836,000,000
2021
72.225,000,000
10,436,000,000
1,956,000,000
84,617,000,000
10,168,000,000
4,866,000,000
15,034,000,000
69,583,000,000
13,135,000,000
56,448,000,000
11,204,000,000
2,384,000,000
97,000,000
1,854,000,000
1,513,000,000
10,770,000,000
27,822,000,000
18,528,000,000
16,010,000,000
16,195,000,000
50,733,000,000
33,537,000,000
8,328,000,000
1,099,000,000
9,427,000,000
24.110,000,000
0
24,110,000,000
2020
82,312,000,000
12,052,000,000
1,944,000,000
96,308,000,000
18,986,000,000
5,058,000,000
24,044,000,000
72,264,000,000
28,000,000,000
44,264,000,000
8,899,000,000
2,155,000,000
3,310,000,000
1,506,000,000
4,647,000,000
9,142,000,000
29,659,000,000
18,005,000,000
14,606,000,000
15,543,000,000
48,154,000,000
25,769,000,000
10,751,000,000
-6,845,000,000
3.906,000,000
21.863,000,000
-211,000
21,862,789,000
3-Year Average
79,815,333, 333.33
13,117,000,000,00
1,798, 666,666.67
94,731,000,000.00
14,658, 333, 333.33
4,435,000,000.00
19,093,333, 333.33
75,637,666,666.67
16,767,333,333.33
58,870, 333, 333.33
10,480, 666,666.67
2,385, 333, 333.33
1,421,333, 333.33
1,579,666,666.67
2,124,666,666.67
12,321, 666,666.67
30, 313, 333, 333.33
18,687,000,000.00
16,459,000,000.00
17,146,333,333.33
52, 292, 333, 333.33
36,891,333, 333.33
10,505,666,666.67
(2,217,333, 333.33)
8,288, 333, 333.33
28,603,000,000.00
(70,333.33)
28,602,929,666.67
Percentage
84.255%
13.847%
1.899%
100.000%
15.474%
4.682%
20.155%
79.845%
17.700%
62.145%
11.064%
2.518 %
1.500%
1.668%
2.243%
13.007%
31.999%
19.726%
17.374%
18.100%
55.201%
38.943%
11.090%
-2.341%
8.749%
30.194%
0.000%
30.194%
Expert Solution
This question has been solved!
Explore an expertly crafted, step-by-step solution for a thorough understanding of key concepts.
Step by stepSolved in 3 steps

Knowledge Booster
Learn more about
Need a deep-dive on the concept behind this application? Look no further. Learn more about this topic, accounting and related others by exploring similar questions and additional content below.Similar questions
- Question 7 Z scores are: A. Used to evaluate the quality of imaged files B. Used to identify outliers in data C. A fraud score based on ISO standards D. Issued by the SEC to identify public companies that are experiencing risk assurance problem ReplyForwardarrow_forwardGodoarrow_forwardD.e.d.u.c.t.i.o.n.s. .f.r.o.m. .G.r.o.s.s. .I.n.c.o.m.e. N.o.t.e.:. .I.n.c.o.m.e. .t.a.x.a.t.i.o.n. .-. .P.h.i.l.i.p.p.i.n.e.s. .b.a.s.e.d D.e.f.i.n.e. .".b.u.s.i.n.e.s..s ..e.x.p.e.n.s.e.s...".?. .D.i.f.f.e.r.e.n.t.i.a.t..e. .t.he. ..a.l.l.o.w.a.b.l.e. O.S.D. .f.o.r. .i.n.d.i.v.i.d.u.a.l. .f.r.o..m .t.h.a.t. .o.f. .t.h.e. .c.o.r.p.o.r.a.t.i.o.n. E.n.u.m.e.r.a.t.e. .t.h.e. .t.a.x.p.a.y.e.r.s. .t.h.a.t. .a.r.e. .a.l.l.o.w.e.d .t.o. .d.e.d.u.c.t. .O.S.D. C.a.n. .a. .h..u.s.b.a.n.d. .c.l.a..i.m .O.S.D. ..w.h.i.le. .t.h.e. .w.i.f.e.. .cl.a.i.m.. i.t.e.m.i.z.e.d. .d.e.d..u.c.t.i.o.n.s. .(.v.i.s.e.. .v.e.r.s.a.). .i.n. .t.h.e.i.r.. c.o.n.s.o.l.i.d.a.t..ed. .I.T.R.?.. .J.u.s.t.i.f.y. .y.o.u.r. .a.n.s..w.e.r. D.e.f.i.n.e. ."..i.t.e.m.i.z.e.d. .d.e.d.u.c.t..i.o.n.s..".?.. E.n.u.m.e.r.a.t.e. .t.h.e. .i.n.c.o.m.e.s. .t.h.a.t. .a.r.e. .g.r.a.n.t.e.d. .w.i.t.h. .a.l.l.o.w.a.b.l.e. .i.t.e.m.i.z.e.d. .d.e.d.u.c.t.i.o.n.s. W.h.a.t. .i.s. .a. .".g.e.n.e.r.a.l. .b.u.s.i.n.e.s.s. .e.x.p.e.n.s.e.s.".?.…arrow_forward
- O.f. .t.h.e. .d.i.f.f.e.r.e.n.t. .t.y.p.e.s. .o.f. .c.r.e.d.i.t. .c.a.r.d.s. .i.n. .t.h.e. .P.h.i.l.i.p.p.i.n.e.s. .y.o.u. .g.a.v.e.,. B.D.O. .i.s. .y.o.u.r. .c.h.o.i.c.e. .a.s. .t.h.e. .b.e.s.t. .c.r.e.d.i.t. .c.a.r.d... .G.i.v.e. .a. .r.e.f.l.e.c.t.i.v.e. .j.o.u.r.n.a.l. .o.f. .w.h.y. .i.t. .i.s. .t.h.e. .b.e.s.t. .c.r.e.d.i.t. .c.a.r.d.,. .i.n.c.l.u.d.i.n.g. .t.h.e. .b.e.n.e.f.i.t.s.,. .a.n.d. .g.i.v.e. .t.h.e. .e.x.a.m.p.l.e.arrow_forwardD.e.d.u.c.t.i.o.n.s. .f.r.o.m. .G.r.o.s.s. .I.n.c.o.m.e. N.o.t.e.:. .I.n.c.o.m.e. .t.a.x.a.t.i.o.n. .-. .P.h.i.l.i.p.p.i.n.e.s. .b.a.s.e.d A.r.e. .a.l.l. .o.r.d.i.n.a.r.y. .e.x.p.e.n.s.e.s. .n.e.c.e.s.s.a.r.y.?. .W.h.e.n. .i.s. .s.a.l.a.r.y. .e.x.p.e.n.s.e .d.e.d.u.c.t.i.b.l.e.? I.s. .c.o.m.p.e.n.s.a.t.i.o.n.. f.o..r .i.n.j.u.r.i.e.s. .a.n.d. .p.e.n.s.i.o.n.s. d.e.d.u.c.t.i.b.l.e.. f.r.o.m. .b.u.s.i.n.e.s.s. .i.n.c.o.m.e. .o.f. .p.a.y.o.r.? W.h.a.t. .a.r.e. .t.h.e. ..t.a.x. .t.r.e.a.t.m.e.n.t.s. .i.f. .m.a.t.e.r.i.a.l.s. .a.n.d. .s.u.p.p.l.i.e.s. .a.r.e. .u.s.e.d. .d.i.r.e.c.t.l.y. .a.n.d. .i.n.d.i.r.e.c.t.l.y. .i.n. .p.r.o.d.u.c.i.n.g. .p.r.o.d.u.c.t.s.? S.t.a.t.e. .t.h.e. .r.u.l.e.s. .o.n. .t.h.e. .d.e.d.u.c.t.i.b.i.l.i.t.y. .o.f. .r.e.n..t .e.x.p.e.n.s.e.s. .a..re. .p.a.i.d. .u.n.d.e.r. .a.c.c.r.u.a.l. .a.n.d. .u.n.d.e.r. .c.a.s.h. .m.e.t.h.o.d. S.t.a.t.e. .t.h.e. .c.e.i.l.i.n.g.s. .f.o.r. .d.e.d.u.c.t.i.b.l.e. .r.e.p.r.e.s.e.n.t.a.t.i.o.n. .e.x.p.e.n.s.e.s.?. .E.x.p.l.a.i.n.…arrow_forwardE.v.a.l.u.a.t.e. .a.n.d. .e.x.p.l.a.i.n. .t.h.e. .s.t.a.t.e.m.e.n.t. .o.f. .f.i.n.a.n.c.i.a.l. .p.o.s.i.t.i.o.n. .b.e.l.o.w.arrow_forward
arrow_back_ios
arrow_forward_ios
Recommended textbooks for you

 AccountingAccountingISBN:9781337272094Author:WARREN, Carl S., Reeve, James M., Duchac, Jonathan E.Publisher:Cengage Learning,
 Accounting Information SystemsAccountingISBN:9781337619202Author:Hall, James A.Publisher:Cengage Learning,
 Horngren's Cost Accounting: A Managerial Emphasis...AccountingISBN:9780134475585Author:Srikant M. Datar, Madhav V. RajanPublisher:PEARSON
 Intermediate AccountingAccountingISBN:9781259722660Author:J. David Spiceland, Mark W. Nelson, Wayne M ThomasPublisher:McGraw-Hill Education
 Financial and Managerial AccountingAccountingISBN:9781259726705Author:John J Wild, Ken W. Shaw, Barbara Chiappetta Fundamental Accounting PrinciplesPublisher:McGraw-Hill Education


Accounting
Accounting
ISBN:9781337272094
Author:WARREN, Carl S., Reeve, James M., Duchac, Jonathan E.
Publisher:Cengage Learning,

Accounting Information Systems
Accounting
ISBN:9781337619202
Author:Hall, James A.
Publisher:Cengage Learning,

Horngren's Cost Accounting: A Managerial Emphasis...
Accounting
ISBN:9780134475585
Author:Srikant M. Datar, Madhav V. Rajan
Publisher:PEARSON

Intermediate Accounting
Accounting
ISBN:9781259722660
Author:J. David Spiceland, Mark W. Nelson, Wayne M Thomas
Publisher:McGraw-Hill Education

Financial and Managerial Accounting
Accounting
ISBN:9781259726705
Author:John J Wild, Ken W. Shaw, Barbara Chiappetta Fundamental Accounting Principles
Publisher:McGraw-Hill Education