
A First Course in Probability (10th Edition)
10th Edition
ISBN: 9780134753119
Author: Sheldon Ross
Publisher: PEARSON
expand_more
expand_more
format_list_bulleted
Related questions
Question

Transcribed Image Text:Ins
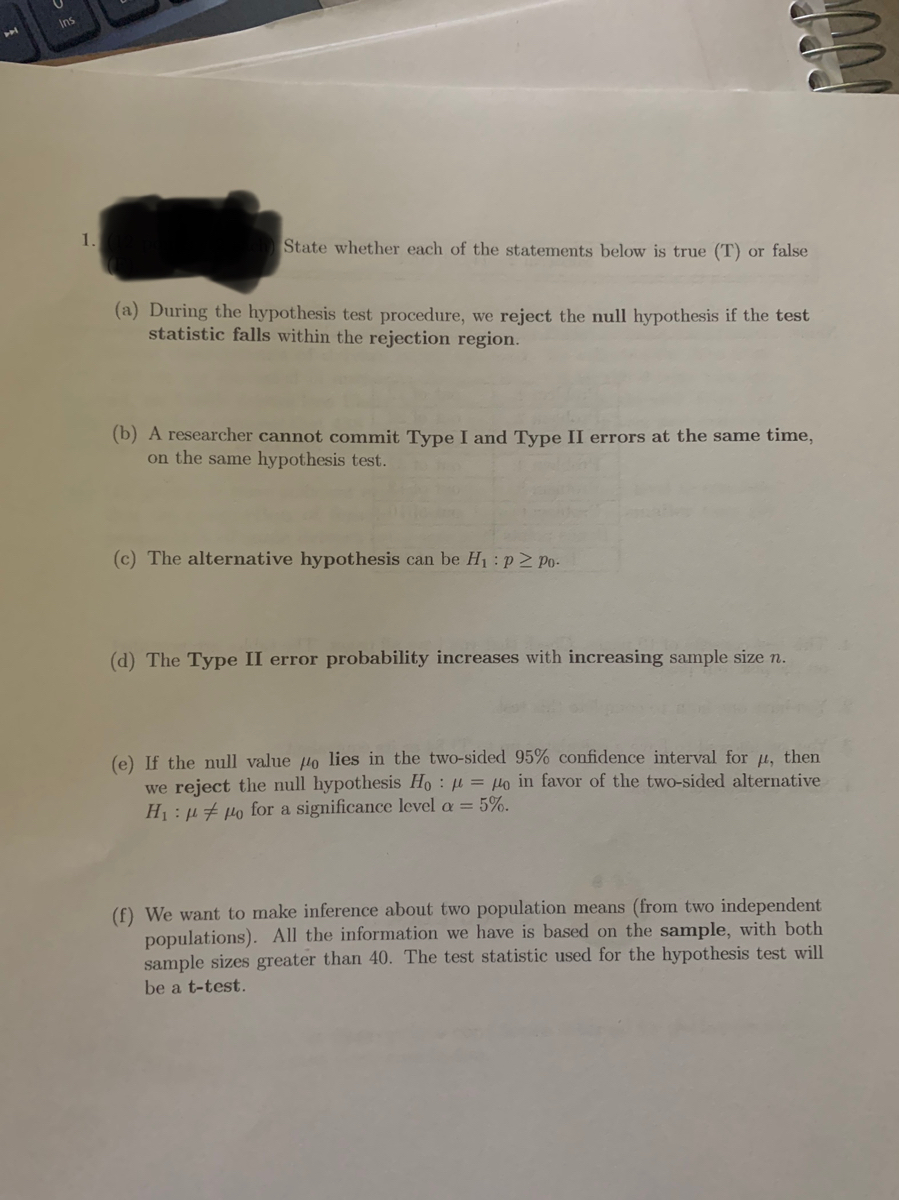
1.
State whether each of the statements below is true (T) or false
(a) During the hypothesis test procedure, we reject the null hypothesis if the test
statistic falls within the rejection region.
(b) A researcher cannot commit Type I and Type II errors at the same time,
on the same hypothesis test.
(c) The alternative hypothesis can be H1:p2 Po-
(d) The Type II error probability increases with increasing sample size n.
(e) If the null value lo lies in the two-sided 95% confidence interval for u, then
we reject the null hypothesis Ho : µ = Ho in favor of the two-sided alternative
H1: µ # µo for a significance level a = 5%.
(f) We want to make inference about two population means (from two independent
populations). All the information we have is based on the sample, with both
sample sizes greater than 40. The test statistic used for the hypothesis test will
be a t-test.
Expert Solution
This question has been solved!
Explore an expertly crafted, step-by-step solution for a thorough understanding of key concepts.

Step by stepSolved in 3 steps with 2 images

Knowledge Booster

Similar questions
- Can you help me determine the test statistic, the P-value, and the conclusion for this hypothesis test?arrow_forwardSuppose that in a random selection of 100 colored candies, 21% of them are blue. The candy company claims that the percentage of blue candies is equal to 20%. Use a 0.10 significance level to test that claim. H, p#0.2 Identify the test statistic for this hypothesis test. The test statistic for this hypothesis test is (Round to two decimal places as needed.)arrow_forwardIf the p-value is very large (say close to 1), then it is likely that we will reject the null hypothesis. True Falsearrow_forward
- 1- Type II error occurs when a false null hypothesis is not rejected Select one: True Falsearrow_forwardConsider the following hypothesis test. Ho: H₁ - H₂ SO Ha: M₁ - H₂ > O The following results are for two independent samples taken from the two populations. Sample 1 Sample 2 n₁ = 40 7₂ = 50 X₁ = 25.4 %1 = 5.7 (a) What is the value of the test statistic? (Round your answer to two decimal places.) = 22.8 x₂ = %₂ = 6 (b) What is the p-value? (Round your answer to four decimal places.) (c) with a = 0.05, what is your hypothesis testing conclusion? Reject Ho. There is insufficient evidence to conclude that μ₁ - H₂ > 0. Reject Ho. There is sufficient evidence to conclude that μ₁ - μ₂ > 0. Do not reject Ho. There is insufficient evidence to conclude that μ₁ - μ₂ > 0. Do not Reject Ho. There is sufficient evidence to conclude that μ₁ −μ₂ > 0. -arrow_forwardImagine you are doing a Related-Samples t-test, and you are on Step One of the hypothesis test. If you are doing the test with α = .05, and two tails, how would the H0 (null hypothesis) look?arrow_forward
- (D) decide whether to reject or fail to reject the null hypothesis and (e) interpret the decision in the context of the original claim. (Reject, fail to reject) the null hypothesis. There (is, is not) enough evidence to (support,reject) the center’s claim.arrow_forwardThree students, an athlete, a fraternity member, and an honors student, record the number of hours they slept each night for 20 nights. O JMP Applet imp ? Oneway Analysis of Sleep Hours By Student Oneway Analysis of Sleep Hours By Student 10 Oneway Anova 14 Summary of Fit 12 Rsquare 0.024506 10- Adj Rsquare Root Mean Square Error Mean of Response Observations (or Sum Wgts) -0.00072 1.99517 7.7 60 Analysis of Variance Sum of Mean F Prob > Source DF Squares Square Ratio F 2 Athiete Frat Honors Student 2 5.70000 2.85000 0.7180 0.4931 Student Error 57 226.90000 3.98070 C. Total 59 232.60000 Oneway Anova Means for Oneway Anova Std Lower Upper 95% Summary of Fit Level Number Mean Error 95% Athlete 20 8.10000 0.44813 7.2086 8.9934 Rsquare 0.024506 Frat 20 7.65000 0.44813 6.7588 8.5434 Adj Rsquare Root Mean Square Error Mean of Response Observations (or Sum Wgts) -0.00972 Honors 20 7.35000 0.44813 6.4586 8.2434 1.99517 Std Error uses a pooled estimate of error variance 7.7 60 Analysis of…arrow_forwardZ= and P-value=arrow_forward
- A professor notices that more and more students are using their laptop computers in class to take notes. He wonders if this may improve academic success. To test this, the professor records the number of times each student uses his or her laptop during a class for one semester (Laptop) and the final grade in the class out of 100 points (Grade). The professor wants to conduct a hypothesis test to test whether or not there is a significant relationship between Laptop and Grade at the .05 level of significance. Laptop Grade 30 86 23 88 6 94 0 56 24 78 36 72 10 80 0 90 0 82 8 60 12 84 18 74 0 78 32 66 36 54 12 98 8 81 18 74 22 70 38 90 5 85 29 93 26 67 10 80 Using excel, create a scatterplot and interpret. Does it seem to suggest there is a relationship? Write the null hypothesis and alternative hypothesis in symbols Using excel, obtain the correlation coefficient and report the output for the hypothesis test. Make a decision about…arrow_forwardWhat type of error(s) occur(s) when we reject the null hypothesis when the null hypothesis is true? OA. Type 1 Error OB. Type II Error OC. Both Type I and Type II Errors OD. Neither Type I nor Type II Errorarrow_forward
arrow_back_ios
arrow_forward_ios
Recommended textbooks for you
- A First Course in Probability (10th Edition)ProbabilityISBN:9780134753119Author:Sheldon RossPublisher:PEARSON

A First Course in Probability (10th Edition)
Probability
ISBN:9780134753119
Author:Sheldon Ross
Publisher:PEARSON