
MATLAB: An Introduction with Applications
6th Edition
ISBN: 9781119256830
Author: Amos Gilat
Publisher: John Wiley & Sons Inc
expand_more
expand_more
format_list_bulleted
Related questions
Question
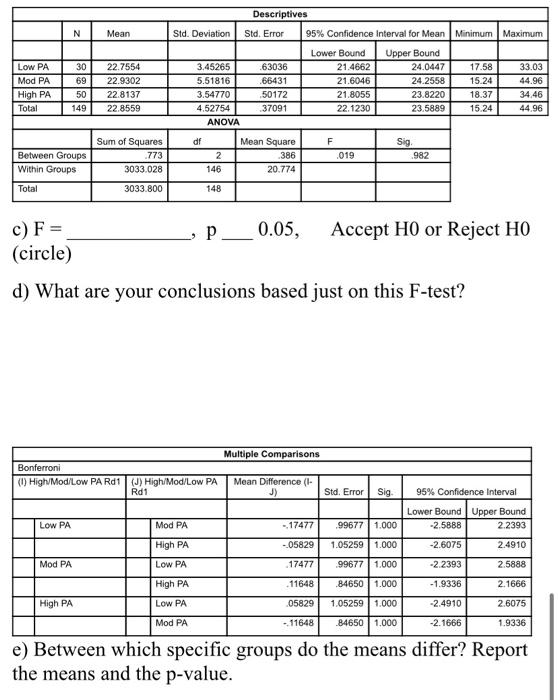

Transcribed Image Text:Descriptives
Mean
Std. Deviation
Std. Error
95% Confidence Interval for Mean Minimum Maximum
Lower Bound
Upper Bound
Low PA
30
22.7554
3.45265
.63036
21.4662
24.0447
17.58
33.03
Mod PA
69
22.9302
5.51816
66431
21.6046
24.2558
15.24
44.96
High PA
50
22.8137
3.54770
.50172
21.8055
23.8220
18.37
34,46
Total
149
22.8559
4.52754
37091
22.1230
23,5889
15.24
44.96
ANOVA
Sum of Squares
df
Mean Square
Sig.
Between Groups
.773
2
386
.019
.982
Within Groups
3033.028
146
20.774
Total
3033.800
148
c) F =
(circle)
0.05,
Accept H0 or Reject HO
d) What are your conclusions based just on this F-test?
Multiple Comparisons
Bonferroni
(1) High/Mod/Low PA Rd1 | (J) High/Mod/Low PA
Rd1
Mean Difference (I-
J)
Std. Error
Sig.
95% Confidence Interval
Lower Bound Upper Bound
Low PA
Mod PA
17477
.99677 1.000
-2.5888
2.2393
High PA
-.05829
1.05259 1.000
-2.6075
2.4910
Mod PA
Low PA
.17477
99677 1.000
-2.2393
2.5888
High PA
.11648
.84650 1.000
-1.9336
2.1666
High PA
Low PA
.05829
1.05259 | 1.000
-2.4910
2.6075
Mod PA
-11648
.84650 1.000
-2.1666
1.9336
e) Between which specific groups do the means differ? Report
the means and the p-value.

Transcribed Image Text:6. Do individuals with different physical activity levels (Low,
Moderate and High) have different BMI levels?
a) Identify the Independent Variable (IV) and the Dependent
Variable (DV):
b) Specify the H, and H, using both sentences and notation:
H, (sentence):
H, (notation):
H, (sentence):
H, (notation):
Desere
Den Dr E
. C
Lahn
AST
15470
Te
1
ANOVA
Sumof Sares
Mean Spare
773
w Gree
14
c) F=
(circle)
0.05, Accept HO or Reject HO
d) What are your conclusions based just on this F-test?
tipe Cempartse
PA Re Hn A
Ret
S E Ss
NCu ve
Loe nd und
L
Mue P
Hgh RA
Mod PA
Loe M
H
Hgh M
Le M
MocP
e) Between which specific groups do the means differ? Report
the means and the p-value.
Expert Solution
This question has been solved!
Explore an expertly crafted, step-by-step solution for a thorough understanding of key concepts.

Step by stepSolved in 6 steps

Knowledge Booster

Similar questions
- Pls explain the selected option in 5-6 sentence only Which of the following statement(s) are false? (Select all that apply.) a) Correlation measures the strength of a linear relationship between two quantitative variables.-1 ≤ r ≤ 1 b) The sign of r tells the direction of the linear relationship between two quantitative variables. c) The correlation has the same units (e.g., feet or minutes) as the explanatory variable. d) If the correlation between two quantitative variables is zero, then there cannot be a relationship between these two variables.arrow_forwardWhat is the major problem with R 2 and why Adj R 2 is preferred?arrow_forwardA psychologist wants to test the influence of color on object recognition in 4-year olds. She recruits 25 children and shows them two sets of pictures of everyday objects (variable = picture type), has the children name them, and measures the time it takes (variable = reaction time). She shows the children a color set of pictures first and then shows them a black and white set of pictures. a) What is the independent variable? b) What is the dependent variable? c) What is the second independent variable? d) What is the second dependent variable? e) Is "picture type" a within-subjects or between-subjects variable? f) What scale of measurement is reaction time? g) What scale of measurement is picture type? h) The order of presentation of the picture sets is what kind of variable?arrow_forward
- The residents of a housing development for senior citizens have completed a survey whereon they indicated how physically active they are and how many visitors they receive each week. Are these two varibles related for the 10 cases reported below?arrow_forwardQuestion 4The researcher wishes to use graphical descriptive methods to present summaries of the data on each of the two variables: hours worked per week and yearly income, as stored in file HOURSWORKED.jpga) The number of observations (n) is 65 individuals. The researcher suggests using 7 class intervals to construct a histogram for each variable. Explain how the researcher would have decided on the number of class intervals (K) as 7. b) The researcher suggests using class intervals as 10 < X ≤ 15, 15 < X ≤ 20, …, 40 < X ≤ 45 for the hours per week variable and class intervals 40 < X ≤ 45, 45 < X ≤ 50, ..., 70 < X ≤ 75 for the yearly income variable. Explain how the researcher would have decided the width of the above class intervals (or class width). c) Draw and display a histogram for each of the two variables using appropriate BIN values from part (b) and comment on the shape of the two distributions.arrow_forwarda.Consider the two variables, High School GPA and Average Annual Earnings in Adulthood. Which isdependent?b. Describe the relationship between High School GPA and Average Annual Earnings in Adulthood. Is thecorrelation positive or negative? (Write at least two sentences.)c. Does a person’s High School GPA cause them to earn a certain salary in adulthood? Explain.arrow_forward
- Base on the same given data uploaded in module 4, will you conclude that the number of bathroom of houses is a significant factor for house price? I your answer is affirmative, you need to explain how the number of bathroom influences the house price, using a post hoc procedure. (Please treat number of bathrooms as a categorical variable in this analysis) Base on the same given data, conduct an analysis for the variable sale price to see if sale price is influenced by living area. Summarize your finding including all regular steps for your method. Also, will you conclude that larger house corresponding to higher price (justify)?arrow_forwardPlease help with these three parts. ? Thank you!arrow_forwardThe head of the marketing division of a leading chocolate manufacturer must decide among our different wrapper styles for the chocolate. To provide a database for the decision, he has the chocolate placed in the different wrappers and distributes them to five supermarkets. At the end of 2 weeks, he finds that the following amounts of chocolate were sold: Wrapper A Wrapper B Wrapper C Wrapper D 90 98 130 82 State the dependent and independent variable Is this directional or non directional testarrow_forward
arrow_back_ios
arrow_forward_ios
Recommended textbooks for you
- MATLAB: An Introduction with ApplicationsStatisticsISBN:9781119256830Author:Amos GilatPublisher:John Wiley & Sons Inc
 Probability and Statistics for Engineering and th...StatisticsISBN:9781305251809Author:Jay L. DevorePublisher:Cengage Learning
 Statistics for The Behavioral Sciences (MindTap C...StatisticsISBN:9781305504912Author:Frederick J Gravetter, Larry B. WallnauPublisher:Cengage Learning
  Elementary Statistics: Picturing the World (7th E...StatisticsISBN:9780134683416Author:Ron Larson, Betsy FarberPublisher:PEARSON
 The Basic Practice of StatisticsStatisticsISBN:9781319042578Author:David S. Moore, William I. Notz, Michael A. FlignerPublisher:W. H. Freeman
 Introduction to the Practice of StatisticsStatisticsISBN:9781319013387Author:David S. Moore, George P. McCabe, Bruce A. CraigPublisher:W. H. Freeman
MATLAB: An Introduction with Applications
Statistics
ISBN:9781119256830
Author:Amos Gilat
Publisher:John Wiley & Sons Inc
Probability and Statistics for Engineering and th...
Statistics
ISBN:9781305251809
Author:Jay L. Devore
Publisher:Cengage Learning
Statistics for The Behavioral Sciences (MindTap C...
Statistics
ISBN:9781305504912
Author:Frederick J Gravetter, Larry B. Wallnau
Publisher:Cengage Learning
Elementary Statistics: Picturing the World (7th E...
Statistics
ISBN:9780134683416
Author:Ron Larson, Betsy Farber
Publisher:PEARSON
The Basic Practice of Statistics
Statistics
ISBN:9781319042578
Author:David S. Moore, William I. Notz, Michael A. Fligner
Publisher:W. H. Freeman
Introduction to the Practice of Statistics
Statistics
ISBN:9781319013387
Author:David S. Moore, George P. McCabe, Bruce A. Craig
Publisher:W. H. Freeman