Incorrect 
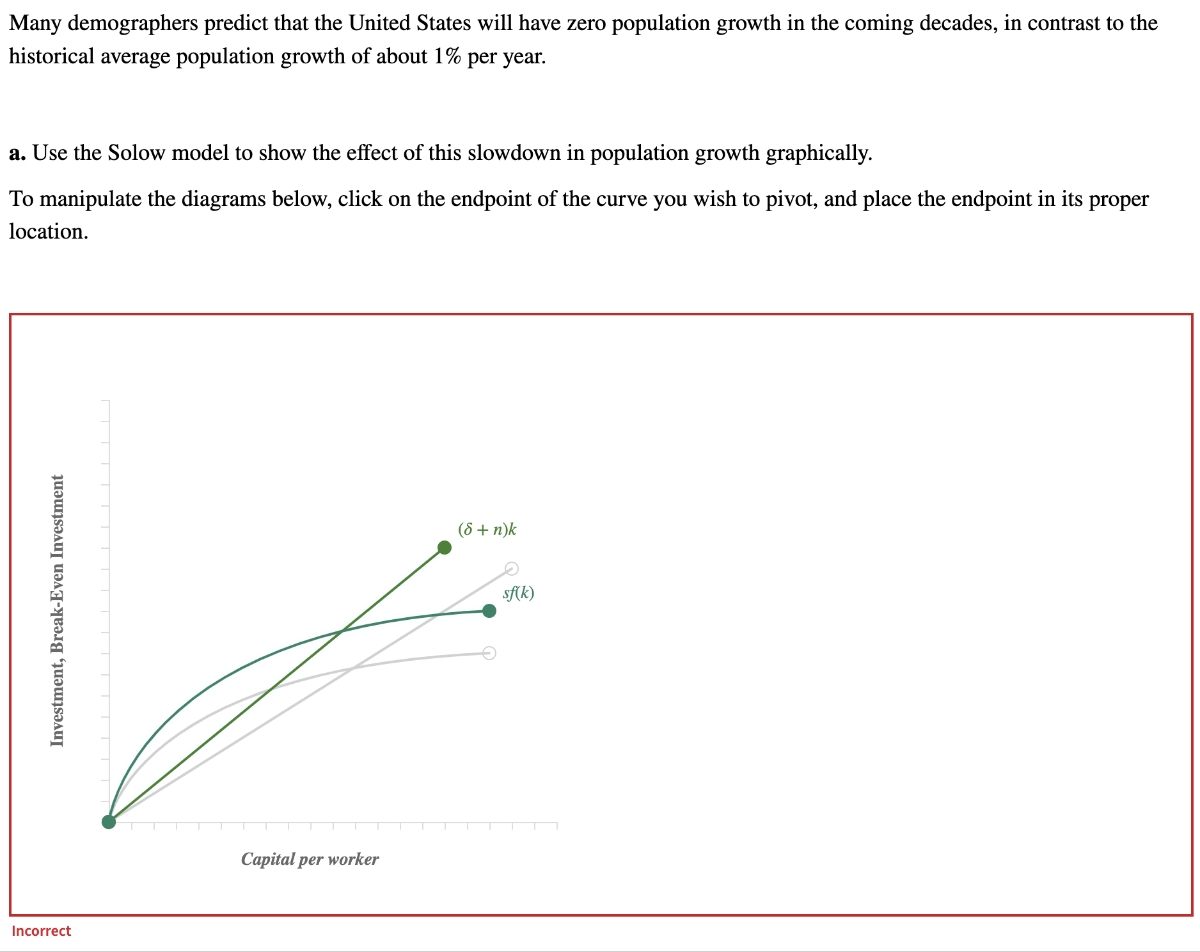
Many demographers predict that the United States will have zero population growth in the coming decades, in contrast to the historical average population growth of about 1% per year. a. Use the Solow model to show the effect of this slowdown in population growth graphically. To manipulate the diagrams below, click on the endpoint of the curve you wish to pivot, and place the endpoint in its proper location. Investment, Break-Even Investment Capital per worker (6+ n)k sf(k)
Q: When should a firm exit the market in the long run
A: Firm entry and exit refers to the process in which new companies enter a market to sell products or…
Q: When the inflation rate is 4% per year, how many inflated dollars will be required 20 years from now…
A: Macroeconomics examines the working, composition, and dynamics of an economy. To comprehend and…
Q: Price level (GDP deflator, 2009 = 100) The graph shows an economy's aggregate demand curve,…
A:
Q: Question 4 Consider the Cournot game with price function P(q) = T/q and payoff functions u = P(q)…
A: It is an economic model in which each firm competes with each other and produces independently. It…
Q: Lifewear, a manufacturer of women's sports clothes, is considering adding a line of skirts and…
A: The objective of the question is to evaluate the financial feasibility of a new product line for…
Q: An 8% $200,000 bond has exactly 9 years to maturity and pays semi-annually. What is the price of the…
A: A bond is a fixed-income financial instrument that represents a loan made by an investor to a…
Q: Price P₁ P2 Ps PA MC ATC AVC If the short-run price is A) P1; break even Quantity , the perfectly…
A: The objective of the question is to understand the relationship between the short-run price and the…
Q: Price and Costs 13. Firms in Competitive Markets The market for fertilizer is perfectly competitive.…
A: A perfectly competitive market is represented by multiple sellers and buyers in the market. Multiple…
Q: In the figure below, what is the point price elasticity of demand when price is $60? 120 P Price ($)…
A: The point elasticity of demand is calculated by the formulaEP=ΔPΔQ∗QPWhere ΔPΔQ indicates the…
Q: This is a reconsideration of the three plans presented in Example 10.1. To recap, the plans are:…
A: PW refers to the current worth of a future amount of money or a sequence of future cash flows,…
Q: Boyd has the following utility function: U = 100B√C where B represents books and C represents audio…
A: Boyd's utility function is given as U = 100B√C, where B represents books and C represents audio CDs.…
Q: The following graph depicts a hypothetical labor market under monopsony. WAGE RATE (dollars per…
A: A monopsony labor market is a market structure in which there is only one buyer (employer) of labor,…
Q: How does a solar cell work? Explain every single compound of the solar cell in detail. Show…
A: Step 1: A solar cell, also known as a photovoltaic (PV) cell, is a device that converts light energy…
Q: From the following data, use the conventional B/C ratio for a project that has a 20-year life to…
A: Present Value of Benefits: PVb=(115,000−10,000)×(1−(1+0.08)^−20)/0.08PVb=105,000×9.818149…
Q: Solve all questions compulsory .....you will not solve all questions then I will give you down…
A: Title: Consumer-Focused Approach to Antitrust Policy and its Implications for Contemporary MarketsIn…
Q: In educational economics, what does the term "rate of return to education" refer to? a) The…
A: It looks at how limited resources such as funds and time are allocated to education.It analyzes…
Q: The owners of a discount motel chain are considering building a new motel. Optimistic, pessimistic,…
A: Answer image:a)Present worth under pessimistic extimate is found as followsPresent worth = $…
Q: The PW-based relation for the incremental cash flow series to find A/* between the lower first-cost…
A: Present worth, also known as present value, is a financial concept used in time value of money…
Q: UNITS OF VARIABLE TOTAL MARGINAL AVERAGE PRICE OF INPUT PRODUCT PRODUCT PRODUCT INPUT TOTAL VARIABLE…
A: However, the relationship between marginal cost and average variable cost is this:When marginal cost…
Q: Price (dolla 10 8 ATC MC MR 6 D 9 10 Quantity/time The firm will maximize its profit at a quantity…
A: It is the financial gain earned by a firm after deducting all costs(C) from total revenue(TR). The…
Q: The table below shows information for 3 stocks. Security Beta Risk-free rate Expected market…
A: 1. Understand the CAPM Formula:The CAPM formula calculates the expected return of a stock based on…
Q: Consider the model of a firm that produces final goods using R&D and components as inputs, with…
A: The objective of the question is to understand the intensity of factors in assembly and R&D, and…
Q: What is the present worth of cash flows that begin at $15,000 and increase at 8% per year for 10…
A: In a formal financial context, the Present Worth (PV) of a Cash Flow is a single, current dollar…
Q: 2-A company decided to buy a new machine for its production line. The costs and benefits of…
A: The benefit-cost ratio is determined as the ratio of the present value of the benefits and the…
Q: Which of the following statements is true regarding a Section 1035 exchange of life insurance…
A: Insurance is a contractual arrangement in which an individual or entity (the insured) pays a premium…
Q: 9. The kinked demand curve Wilke is a manufacturer in the oligopolistically competitive market for…
A: According to the law of demand, when other factors are constant, increase in price leads to decrease…
Q: The figure to the right depicts the short-run outcome for a firm in a monopolistically competitive…
A: We know that Profits are maximized when both Marginal Revenue (MR) and Marginal Cost (MC) are…
Q: 1. Many endogenous growth models feature so called scale effects: per capita growth rises when…
A:
Q: Demonstrate how a price floor is like a tax on consumers and a subsidy to suppliers. Instructions:…
A: Tax is the compulsory monetary payment charged by the government to the public. The proceeds…
Q: None
A: FEEL FREE TO ASK FOR CLARIFICATIONS
Q: None
A: 1. A 25% increase in income (40000 to 50000) would increase demand & shift demand curve…
Q: The following graph plots the planned expenditure line (PE) for an economy in which current…
A: Given, the full employment income is $650 billion and the current level of equilibrium income is…
Q: One of the key provisions of the Affordable Care Act was the ensuring coverage for “pre- existing…
A: Nash equilibrium is a fundamental concept in game theory that describes a situation in which every…
Q: A firm with Perfect Competition in the Labour Market and Perfect Competition in the Output Market.…
A: The perfect competition market is represented by multiple buyers and multiple sellers in the market.…
Q: Please answer the following questions below for our Module 4 assignment. You can either type your…
A: Based on the problem, let's take an example where cell A equals 16 because the birthdate is 16th.…
Q: Asaaregent needed
A: The objective of the question is to identify the correct definition of game theory from the given…
Q: Based on the table below, what is the optimal Level of Activity? Total benefit Total cost Level of…
A: Detailed explanation: To determine the optimal level of activity based on the provided table, we…
Q: Title Use the equilibrium of the second-price, Dutch, and English auctions to construct…
A: An auction is a public sale wherein goods, services, or houses are sold to the very best bidder. In…
Q: None
A:
Q: 11. Calculating the price elasticity of supply Kevin is a retired teacher living in Philadelphia who…
A: The price elasticity of supply measures the percentage change in the quantity supplied by the…
Q: The simultaneous-move game G is player twice, with the outcome of the first stage observed before…
A: To find the subgame-perfect outcome, we need to analyze the game from the end to the beginning,…
Q: 7. Short-run supply and long-run equilibrium Consider the competitive market for steel. Assume that,…
A: Short-Run Supply: A Production Decision Based on Marginal CostImagine you're a manager at a steel…
Q: Use the graph to answer the following 5 questions. A single priced unregulated monopolist faces the…
A: The monopoly market is represented by a single supplier in the market. The monopolist seller…
Q: Which of the following is an equitable remedy available in a civil proceeding? Π money damages Π an…
A: The task is to determine which of the listed options is considered a fair remedy in a civil case.
Q: Exhibit Economic Adjustments if the economy is at point a, Group of answer choices employment is…
A: The topic described in the question is related to the money market in economics, which is the…
Q: None
A: Social cost: The total cost incurred by society as a direct result of any economic activity or…
Q: Suppose there is a simple hypothetical economy in which the only industry is cloud computing. In the…
A: Productivity is the ratio of amount of output produced and amount of a input used in that…
Q: None
A: Personal income is defined as the income received by all persons in the economy. It includes wages,…
Q: Use the following payoff matrix for a one-shot game to answer the accompanying questions. Player 1…
A: Nash equilibrium is an outcome in game theory that a player can achieve without deviating from the…
Q: Durable goods 400 Nonresidential investment Federal purchases of goods Exports 300 250 550 State and…
A: The proportion of personal consumption expenditures in GDP is vital, as it mirrors consumer…
Trending now
This is a popular solution!
Step by step
Solved in 2 steps
- What do the growth accounting studies conclude are the determinants of growth? Which is more important, the determinants or how they am combined?n the endogenous growth model, suppose that there are three possible uses of time. Let u = the fraction of time spent working s = fraction of time spent neither working nor accumulating human capital (unemployment) 1 – u – s = fraction of time spent accumulating human capital If z = 1, b = 5, and the economy begins in period 1 with 100 units of human capital, find the values of Y, H, and Y’ for each of the scenarios below. In this model, does the scenario with the greater human capital accumulation lead to the highest per capita income (Yes/No)? u s H Y H' Y' .7 .05 100 .6 .15 100 .6 .05 100 .5 .10 100 Does the scenario with the greater human capital accumulation lead to the highest per capita income (Yes/No)?The following table shows the GDP per capita of various countries forthe years 1960 and 2010 in PPP-adjusted 2005 dollars. The table alsocontains the implied growth rates, which show how much on average eachcountry needed to grow each year to reach the 2010 level of GDP per capitastarting from the 1960 level of GDP per capita. Use the table to answer thefollowing questions. 1. During 1960-2010, which countries were able to reduce the gap betweentheir GDP per capita and the U.S. GDP per capita?
- 3. Take the Malthus model absent technological change and capital with the following birth and death rate functions. Birth rate Death rate a. Plot the population growth rate function corresponding to the death rate and birth rate functions above. b. Find the Steady state consumption levels and population levels for this economy. c. Thomas Malthus had a very pessimistic view of the conditions of the human race in that he believed that any increase in the living standard due to a sudden decrease in the population would be temporary. This is indeed the prediction of the Malthus model we studied in class. Does the version of the Malthus Model in this question make the same prediction? Use graphs in your answer.Solow-Swan Model Assume an economy with a production function that exhibits constant returns to capital.1 Ineach of the following cases, draw a Solow-Swan diagram and use is to explain whether andhow the economy converges to a steady state. Clearly identify any steady state(s) or otherwiseexplain why there is no steady state. (i) Assume the sum of population growth and the depreciation rate is greater than the savingrate.(ii) Instead assume the sum of population growth and the depreciation rate is less than thesaving rate.(iii) Instead assume that the sum of population growth and the depreciation rate is equal tothe saving rate. What is the importance of diminishing returns to capital in the Solow-Swan model?Canadian real GDP per capita is 50,097 (measured in constant 2017 USD, same for thefollowing numbers) in the year 2019 and 40,489 in the year 1999. Canadian real capital stockper capita is 226,225 in the year 2019 and 155,256 in 1999. Calculate the growth rate of GDPper capita in Canada for these two decades, as well as the contribution from productivitygrowth and that from capital accumulation. You can use a capital share α of 1/3.
- In the endogenous growth model of chapter 8, suppose that there are three possible uses of time. Let u denote the fraction of time spent working, s the fraction of time being unemployed and doing nothing, and 1-u-s the fraction of time spent acumulating human capital. Assume that z-1 and b-4.2 Also assume that the economy begins in period 1 with H=100 units of human capital. Suppose that the fraction spent working is 0.7 and the fraction spent unemployed is 0.05. Calculate aggregate human capital in period 5. 120 120.55 121 121.55In the Solow economic model, id like to know the relationship between the rate of population growth and the steady state level of income. I know that when the rate of population growth grow, then the breakeven investment line goes up, which decreses investment and capital per worker, but what does it do to the income level and the steady state rate of growth?Consider the endogenous growth model with two sectors: manufacturing firms and research universities. Which of the following affect/s the steady-state growth rate of output in this model? (i) stock of knowledge (ii) fraction of labor force in universities (iii) saving rate O a. Only (ii) O b. Only (iii) O c. Only (i) O d. (i), (ii), and (iii)
- The following table shows the GDP per capita of various countries forthe years 1960 and 2010 in PPP-adjusted 2005 dollars. The table alsocontains the implied growth rates, which show how much on average eachcountry needed to grow each year to reach the 2010 level of GDP per capitastarting from the 1960 level of GDP per capita. Use the table to answer thefollowing questions. 1. During 1960-2010, which countries failed to reduce the gap betweentheir GDP per capita and the U.S. GDP per capita?For which of the following does the Solow model NOT provide adequate explanation? O a. Why saving rates differ across countries *b. All of these answers are correct Oc. Why population growth rates differ across countries The case ai productivity differences across countries What causes long-term economic growthQ4. Illustrate the Steady-State of the Solow-Swan model and show the effect of an increase in the savings rate on the Steady-State. PLease write the explanation detail with the diagram.