
ENGR.ECONOMIC ANALYSIS
14th Edition
ISBN: 9780190931919
Author: NEWNAN
Publisher: Oxford University Press
expand_more
expand_more
format_list_bulleted
Related questions
Question

Transcribed Image Text:Include correctly labeled diagrams, if useful or required, in explaining your answers. A correctly labeled diagram must have all axes and
curves clearly labeled and must show directional changes. If the question prompts you to "Calculate," you must show how you arrived at
your final answer.
Use the following graph to answer parts (a)-(e). Prices and costs are in dollars.
30
27
24
21
18
15
12
9
6
3
0
Price, Cost
10 20 30 40 50
MC
ATC
60 70
MR
D
80 90 100
Quantity
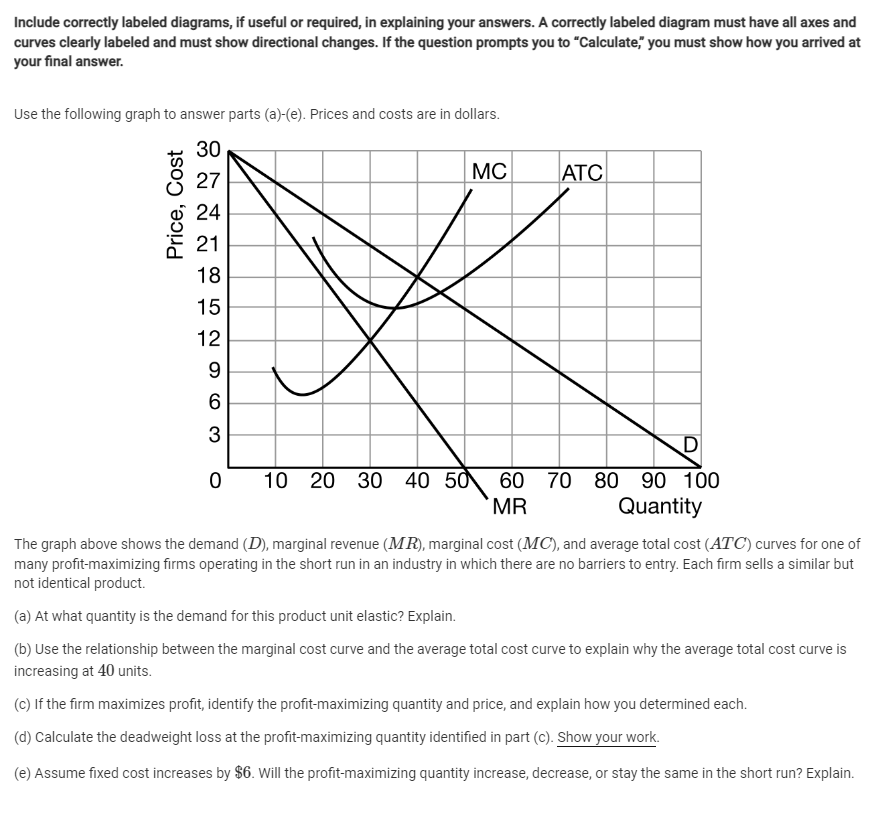
The graph above shows the demand (D), marginal revenue (MR), marginal cost (MC), and average total cost (ATC) curves for one of
many profit-maximizing firms operating in the short run in an industry in which there are no barriers to entry. Each firm sells a similar but
not identical product.
(a) At what quantity is the demand for this product unit elastic? Explain.
(b) Use the relationship between the marginal cost curve and the average total cost curve to explain why the average total cost curve is
increasing at 40 units.
(c) If the firm maximizes profit, identify the profit-maximizing quantity and price, and explain how you determined each.
(d) Calculate the deadweight loss at the profit-maximizing quantity identified in part (c). Show your work.
(e) Assume fixed cost increases by $6. Will the profit-maximizing quantity increase, decrease, or stay the same in the short run? Explain.
Expert Solution
arrow_forward
Step 1
Incase of a monopoly ,
A monopolist profit maximizing point is where the MC curve intersects the MR curve.
The total revenue is maximum where MR is zero.
And the TR is maximum where the demand is unit Elastic.
[Dear student as you have posted multipart question, we are supposed to do only the first three subparts. Please repost the question again stating the remaining subparts].

Trending nowThis is a popular solution!

Step by stepSolved in 2 steps

Knowledge Booster


Learn more about
Need a deep-dive on the concept behind this application? Look no further. Learn more about this topic, economics and related others by exploring similar questions and additional content below.Similar questions
- What is the relationship between marginal cost (MC) curves and average cost (AC) curves? You may use a graph help you illustrate whenever necessary.arrow_forwardplease helparrow_forwardOutput AFC AVC ATC MC 1 300 100 400 100 2 150 75 225 50 3 100 70 170 60 4 75 73 148 80 5 60 80 140 110 6 50 90 140 140 7 43 103 146 180 8 38 119 156 230 9 33 138 171 290 10 30 160 190 360 Refer to the chart above. The total fixed costs are what?arrow_forward
- 1.Prepare a table with MC, ATC, AVC and AFC curves. Be sure to INCLUDE NUMBERS IN YOUR GRAPH. ALSO, PLOT THE CURVES Please create a picture illustration using the provided instructions. Example numbers may be used to complete the question. Please include details as I need an understanding of the material. If you don't understand the question skip it please.arrow_forwardFrom the graph given in image,if three micro ovens are produced,average variable cost are?arrow_forwardOUTPUT TOTAL COST 40 49 2 57 3 64 4 70 5 77 6 85 The TVC of producing 4 units of output is : The AFC of producing 6 units of output is: : The marginal cost of producing the fifth unit of output is: : The ATC of producing 5 units of output is:arrow_forward
- urses H 880 alendar 24 Inbox History ? Help SC K- 7 Q A Refer to the table below, which presents costs associated with a small business selling cookies. Total cost ($) 7 Quantity O cookies 1 cookie 2 cookies 3 cookies 4 cookies 5 cookies :8: 5.3 Calculate the average variable cost of producing 3 cookies. Do not express your answer in units (i.e., if your answer is "$600", type "600"). If necessary, round your answer to one decimal place. 2 W S F2 # 3 80 F3 20 E JAN 5 D $ 4 888 R F F4 % 5 T F5 6 me F6 MacBook Air Y H & N 8⁰ 10.50 13.50 16 18 20 7 F7 U tv NAⓇ * 8 J ► 11 FO ( 9 D 1 K F9 O ) O W F10 L P Aa zoom + { 1 Submit F12 M htm delesarrow_forwardFor each lettered space in the following table, determine the appropriate dollar amount.arrow_forward
arrow_back_ios
arrow_forward_ios
Recommended textbooks for you
 Principles of Economics (12th Edition)EconomicsISBN:9780134078779Author:Karl E. Case, Ray C. Fair, Sharon E. OsterPublisher:PEARSON
 Engineering Economy (17th Edition)EconomicsISBN:9780134870069Author:William G. Sullivan, Elin M. Wicks, C. Patrick KoellingPublisher:PEARSON
 Principles of Economics (MindTap Course List)EconomicsISBN:9781305585126Author:N. Gregory MankiwPublisher:Cengage Learning
 Managerial Economics: A Problem Solving ApproachEconomicsISBN:9781337106665Author:Luke M. Froeb, Brian T. McCann, Michael R. Ward, Mike ShorPublisher:Cengage Learning
 Managerial Economics & Business Strategy (Mcgraw-...EconomicsISBN:9781259290619Author:Michael Baye, Jeff PrincePublisher:McGraw-Hill Education
Principles of Economics (12th Edition)
Economics
ISBN:9780134078779
Author:Karl E. Case, Ray C. Fair, Sharon E. Oster
Publisher:PEARSON
Engineering Economy (17th Edition)
Economics
ISBN:9780134870069
Author:William G. Sullivan, Elin M. Wicks, C. Patrick Koelling
Publisher:PEARSON
Principles of Economics (MindTap Course List)
Economics
ISBN:9781305585126
Author:N. Gregory Mankiw
Publisher:Cengage Learning
Managerial Economics: A Problem Solving Approach
Economics
ISBN:9781337106665
Author:Luke M. Froeb, Brian T. McCann, Michael R. Ward, Mike Shor
Publisher:Cengage Learning
Managerial Economics & Business Strategy (Mcgraw-...
Economics
ISBN:9781259290619
Author:Michael Baye, Jeff Prince
Publisher:McGraw-Hill Education