ENGR.ECONOMIC ANALYSIS
14th Edition
ISBN: 9780190931919
Author: NEWNAN
Publisher: Oxford University Press
expand_more
expand_more
format_list_bulleted
Concept explainers
Question

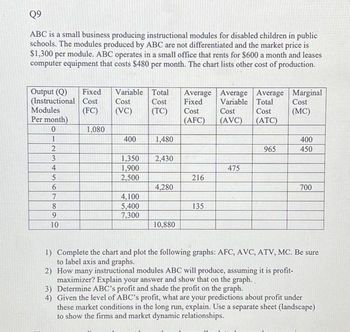
Transcribed Image Text:Q9
ABC is a small business producing instructional modules for disabled children in public
schools. The modules produced by ABC are not differentiated and the market price is
$1,300 per module. ABC operates in a small office that rents for $600 a month and leases
computer equipment that costs $480 per month. The chart lists other cost of production.
Output (Q) Fixed
(Instructional Cost
Modules
Per month)
0
1
2
3
4
5
6
7
8
9
10
Variable Total Average Average
Cost
Cost
Fixed
Variable
(TC)
Cost
(AFC)
(FC) (VC)
1,080
400
1,350
1,900
2,500
4,100
5,400
7,300
1,480
2,430
4,280
10,880
216
135
Cost
(AVC)
475
Average
Total
Cost
(ATC)
965
Marginal
Cost
(MC)
400
450
700
1) Complete the chart and plot the following graphs: AFC, AVC, ATV, MC. Be sure
to label axis and graphs.
2) How many instructional modules ABC will produce, assuming it is profit-
maximizer? Explain your answer and show that on the graph.
3) Determine ABC's profit and shade the profit on the graph.
4) Given the level of ABC's profit, what are your predictions about profit under
these market conditions in the long run, explain. Use a separate sheet (landscape)
to show the firms and market dynamic relationships.
Expert Solution
This question has been solved!
Explore an expertly crafted, step-by-step solution for a thorough understanding of key concepts.
This is a popular solution
Trending nowThis is a popular solution!
Step by stepSolved in 5 steps with 8 images

Knowledge Booster
Learn more about
Need a deep-dive on the concept behind this application? Look no further. Learn more about this topic, economics and related others by exploring similar questions and additional content below.Similar questions
- The table below provides a simple cost schedule for a firm in the short run, complete 1a – 1d using the data. Total Output in thousands (Q) Total Fixed Cost $(TFC) Total Variable Cost (TVC) Total Cost (TC) Marginal Cost (MC) Average Fixed Cost (AFC) Average Variable Cost (AVC) Average Total Cost (ATC) 0 $50 $50 1 $50 20 $70 20 50 20 70 2 $50 $85 3 $50 $95 4 $50 $100 5 $50 $110 6 $50 $130 7 $50 $165 8 $50 $215 9 $50 $275 Fill in the missing data using the cost calculations for short run costsarrow_forwardConsider the following chart. How much is the marginal cost when total output increases from 390 pounds to 450 pounds? Total Output Total Cost Marginal Cost (Pounds) (TC = FC + VC) 0 150 150 300 240 450 320 600 390 750 450 900 420 1050 $1.50 $2.25 $2.00 $2.50arrow_forwardIf the total cost of 20 units of a product is $20, and the total cost of 21 units is $21, then from 20 to Multiple Choice marginal cost is decreasing. marginal cost equals average total cost. marginal cost equals average variable cost. average total cost equals average variable cost. I units of product thearrow_forward
- Costs and Profit Maximization: Work It Out 1 Suppose Margie decides to lease a photocopier and open up a black-and-white photocopying service in her dorm room for use by faculty and students. Her total cost, as a function of the number of copies she produces per month, is given in the table. Number of Photocopies Per Month Total Cost Fixed Cost Variable Cost Total Revenue Profit 0 $100 1,000 $110 2,000 $125 3,000 $145 4,000 $175 5,000 $215 6,000 $285 a. Fill in the missing numbers in the table, assuming that Margie can charge 6 cents per black-and-white copy. Margie's fixed cost is: $ Variable cost, 0 photocopies/month: $ Variable cost, 1,000 photocopies/month: $ Variable cost, 2,000 photocopies/month: $ Variable cost, 3,000 photocopies/month: $ Variable cost, 4,000 photocopies/month: $…arrow_forwardMarginal cost can be calculated both from total cost and total variable cost and is not affected by total fixed cost True/Falsearrow_forwardFor each lettered space in the following table, determine the appropriate dollar amount.arrow_forward
arrow_back_ios
arrow_forward_ios
Recommended textbooks for you

 Principles of Economics (12th Edition)EconomicsISBN:9780134078779Author:Karl E. Case, Ray C. Fair, Sharon E. OsterPublisher:PEARSON
 Engineering Economy (17th Edition)EconomicsISBN:9780134870069Author:William G. Sullivan, Elin M. Wicks, C. Patrick KoellingPublisher:PEARSON
 Principles of Economics (MindTap Course List)EconomicsISBN:9781305585126Author:N. Gregory MankiwPublisher:Cengage Learning
 Managerial Economics: A Problem Solving ApproachEconomicsISBN:9781337106665Author:Luke M. Froeb, Brian T. McCann, Michael R. Ward, Mike ShorPublisher:Cengage Learning
 Managerial Economics & Business Strategy (Mcgraw-...EconomicsISBN:9781259290619Author:Michael Baye, Jeff PrincePublisher:McGraw-Hill Education


Principles of Economics (12th Edition)
Economics
ISBN:9780134078779
Author:Karl E. Case, Ray C. Fair, Sharon E. Oster
Publisher:PEARSON

Engineering Economy (17th Edition)
Economics
ISBN:9780134870069
Author:William G. Sullivan, Elin M. Wicks, C. Patrick Koelling
Publisher:PEARSON

Principles of Economics (MindTap Course List)
Economics
ISBN:9781305585126
Author:N. Gregory Mankiw
Publisher:Cengage Learning

Managerial Economics: A Problem Solving Approach
Economics
ISBN:9781337106665
Author:Luke M. Froeb, Brian T. McCann, Michael R. Ward, Mike Shor
Publisher:Cengage Learning

Managerial Economics & Business Strategy (Mcgraw-...
Economics
ISBN:9781259290619
Author:Michael Baye, Jeff Prince
Publisher:McGraw-Hill Education