
MATLAB: An Introduction with Applications
6th Edition
ISBN: 9781119256830
Author: Amos Gilat
Publisher: John Wiley & Sons Inc
expand_more
expand_more
format_list_bulleted
Related questions
Concept explainers
Question
In this problem, assume that the distribution of differences is approximately normal. Note: For degrees of freedom d.f. not in the Student's t table, use the closest d.f. that is smaller. In some situations, this choice of d.f. may increase the P-value by a small amount and therefore produce a slightly more "conservative" answer.
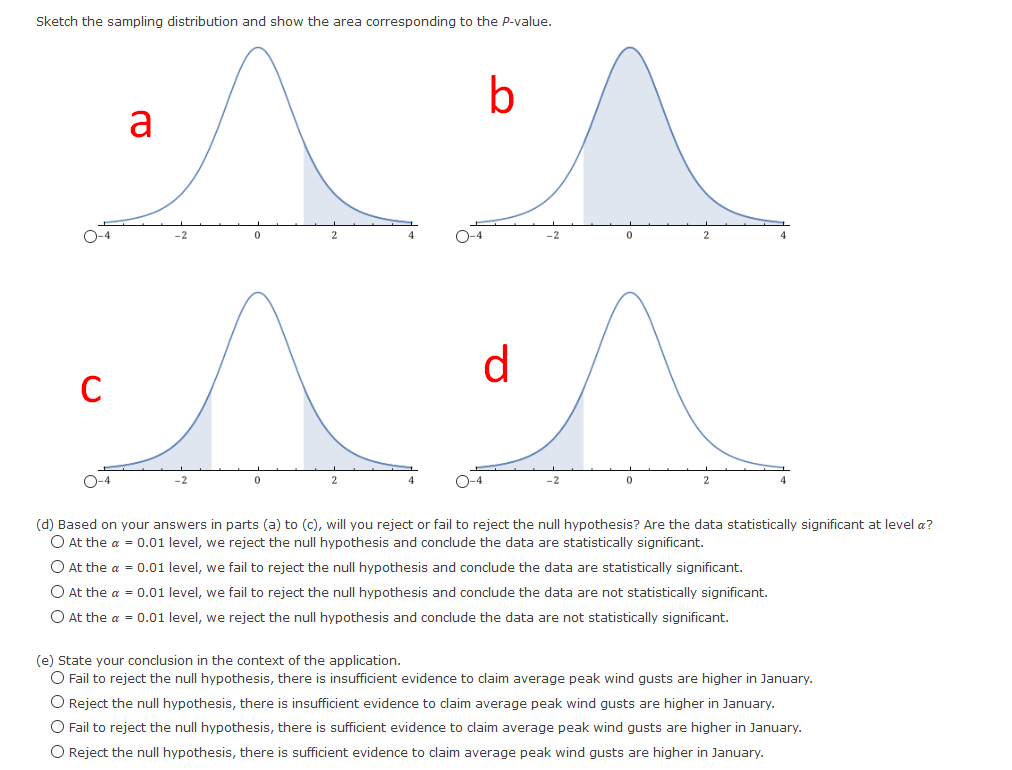

Transcribed Image Text:Sketch the sampling distribution and show the area corresponding to the P-value.
b
a
O-4
-2
-2
d
C
O-4
-2
O-4
4
(d) Based on your answers in parts (a) to (c), will you reject or fail to reject the null hypothesis? Are the data statistically significant at level a?
O At the a = 0.01 level, we reject the null hypothesis and conclude the data are statistically significant.
O At the a = 0.01 level, we fail to reject the null hypothesis and conclude the data are statistically significant.
O At the a = 0.01 level, we fail to reject the null hypothesis and conclude the data are not statistically significant.
O At the a = 0.01 level, we reject the null hypothesis and conclude the data are not statistically significant.
(e) State your conclusion in the context of the application.
O Fail to reject the null hypothesis, there is insufficient evidence to claim average peak wind gusts are higher in January.
O Reject the null hypothesis, there is insufficient evidence to claim average peak wind gusts are higher in January.
O Fail to reject the null hypothesis, there is sufficient evidence to claim average peak wind gusts are higher in January.
O Reject the null hypothesis, there is sufficient evidence to claim average peak wind gusts are higher in January.

Transcribed Image Text:In this problem, assume that the distribution of differences is approximately normal. Note: For degrees of freedom d.f. not in the Student's t table, use the closest d.f. that is smaller. In some situations, this choice of d.f. may increase the P-value by a small amount and therefore
produce a slightly more "conservative" answer.
At five weather stations on Trail Ridge Road in Rocky Mountain National Park, the peak wind gusts (in miles per hour) for January and April are recorded below.
Weather Station
January
2
120
111
3
126
102
1
5
135
64
78
61
Does this information indicate that the peak wind gusts are higher in January than in April? Use a = 0.01. (Let d = January - April.)
April
104
88
(a) What is the level of significance?
State the null and alternate hypotheses. Will you use a left-tailed, right-tailed, or two-tailed test?
O Ho: H = 0; H,: Hg > 0; right-tailed
O Ho: Hd = 0; H: Hd< 0; left-tailed
O Ho: Hd = 0; H,: H# 0; two-tailed
O Ho: Hd > 0; H,: Hg = 0; right-tailed
(b) What sampling distribution will you use? What assumptions are you making?
O The Student's t. We assume that d has an approximately normal distribution.
O The standard normal. We assume that d has an approximately uniform distribution.
O The Student's t. We assume that d has an approximately uniform distribution.
O The standard normal. We assume that d has an approximately normal distribution.
What is the value of the sample test statistic? (Round your answer to three decimal places.)
(c) Find (or estimate) the P-value.
O P-value > 0.250
O 0.125 < Pp-value < 0.250
O 0.050 < P-value < 0.125
O 0.025 < Pp-value < 0.050
O 0.005 < P-value < 0.025
O P-value < 0.005
Expert Solution
This question has been solved!
Explore an expertly crafted, step-by-step solution for a thorough understanding of key concepts.

This is a popular solution

Trending nowThis is a popular solution!

Step by stepSolved in 2 steps with 2 images

Knowledge Booster


Learn more about
Need a deep-dive on the concept behind this application? Look no further. Learn more about this topic, statistics and related others by exploring similar questions and additional content below.Similar questions
- It is thought that prehistoric Indians did not take their best tools, pottery, and household items when they visited higher elevations for their summer camps. It is hypothesized that archaeological sites tend to lose their cultural identity and specific cultural affiliation as the elevation of the site increases. Let x be the elevation (in thousands of feet) for an archaeological site in the southwestern United States. Let y be the percentage of unidentified artifacts (no specific cultural affiliation) at a given elevation. Suppose that the following data were obtained for a collection of archaeological sites in New Mexico: x 5.50 6.50 7.25 8.00 8.75 y 10 41 53 89 89arrow_forwardIn this problem, assume that the distribution of differences is approximately normal. Note: For degrees of freedom d.f. not in the Student's t table, use the closest d.f. that is smaller. In some situations, this choice of d.f. may increase the P-value by a small amount and therefore produce a slightly more "conservative" answer.In the following data pairs, A represents birth rate and B represents death rate per 1000 resident population. The data are paired by counties in the Midwest. A random sample of 16 counties gave the following information. A: 12.5 13.2 12.6 12.1 11.4 11.1 14.2 15.1 B: 9.6 14.3 10.7 14.2 13.2 12.9 10.9 10.0 A: 12.5 12.3 13.1 15.8 10.3 12.7 11.1 15.7 B: 14.1 13.6 9.1 10.2 17.9 11.8 7.0 9.2 Do the data indicate a difference (either way) between population average birth rate and death rate in this region? Use ? = 0.01. (Let d = A − B.) What is the value of the sample test statistic? (Round your answer to three decimal places.)arrow_forwardIt is thought that prehistoric Indians did not take their best tools, pottery, and household items when they visited higher elevations for their summer camps. It is hypothesized that archaeological sites tend to lose their cultural identity and specific cultural affiliation as the elevation of the site increases. Let x be the elevation (in thousands of feet) for an archaeological site in the southwestern United States. Let y be the percentage of unidentified artifacts (no specific cultural affiliation) at a given elevation. Suppose that the following data were obtained for a collection of archaeological sites in New Mexico: x 5.50 6.25 6.75 7.50 8.00 y 6 15 14 52 58 Find ȳ. Group of answer choices –34.75 –17.40 34.75 29.00 17.40arrow_forward
- Only parts c and darrow_forwardIt is thought that prehistoric Indians did not take their best tools, pottery, and household items when they visited higher elevations for their summer camps. It is hypothesized that archaeological sites tend to lose their cultural identity and specific cultural affiliation as the elevation of the site increases. Let x be the elevation (in thousands of feet) for an archaeological site in the southwestern United States. Let y be the percentage of unidentified artifacts (no specific cultural affiliation) at a given elevation. Suppose that the following data were obtained for a collection of archaeological sites in New Mexico: x 5.75 6.25 6.75 7.75 8.25 y 31 26 38 74 72 Find the value of the coefficient of determination r2. –0.939 –0.883 0.883 –0.061 –0.117arrow_forwardIt is thought that prehistoric Indians did not take their best tools, pottery, and household items when they visited higher elevations for their summer camps. It is hypothesized that archaeological sites tend to lose their cultural identity and specific cultural affiliation as the elevation of the site increases. Let x be the elevation (in thousands of feet) for an archaeological site in the southwestern United States. Let y be the percentage of unidentified artifacts (no specific cultural affiliation) at a given elevation. Suppose that the following data were obtained for a collection of archaeological sites in New Mexico: x 5.25 5.50 5.75 6.00 6.75 y 15 41 29 63 46 Given that r=0.592 and ² = 0.35, should a least squares line be used for predictions if a coefficient of determination of more than 0.5 is required? O Since about 59.2% of the behavior of the y variable can be explained by the corresponding behavior of the x variable if we use the equation of the least-squares line, the…arrow_forward
- It is thought that prehistoric Indians did not take their best tools, pottery, and household items when they visited higher elevations for their summer camps. It is hypothesized that archaeological sites tend to lose their cultural identity and specific cultural affiliation as the elevation of the site increases. Let x be the elevation (in thousands of feet) for an archaeological site in the southwestern United States. Let y be the percentage of unidentified artifacts (no specific cultural affiliation) at a given elevation. Suppose that the following data were obtained for a collection of archaeological sites in New Mexico: 5.00 5.75 6.00 6.50 7.25 12 31 41 52 56 Find o for the equation of the least-squares line y =a+bx. -0.046 20.195 0.046 -0.009 -0.055arrow_forwardIt is thought that prehistoric Indians did not take their best tools, pottery, and household items when they visited higher elevations for their summer camps. It is hypothesized that archaeological sites tend to lose their cultural identity and specific cultural affiliation as the elevation of the site increases. Let x be the elevation (in thousands of feet) for an archaeological site in the southwestern United States. Let y be the percentage of unidentified artifacts (no specific cultural affiliation) at a given elevation. Suppose that the following data were obtained for a collection of archaeological sites in New Mexico: x 5.75 6.25 6.75 7.75 8.25 y 31 26 38 74 72 Find the value of the coefficient of determination r2. Round your answer to three decimal places. Group of answer choices –0.061 –0.883 –0.939 0.883arrow_forwardIt is thought that prehistoric Indians did not take their best tools, pottery, and household items when they visited higher elevations for their summer camps. It is hypothesized that archaeological sites tend to lose their cultural identity and specific cultural affiliation as the elevation of the site increases. Let x be the elevation (in thousands of feet) for an archaeological site in the southwestern United States. Let y be the percentage of unidentified artifacts (no specific cultural affiliation) at a given elevation. Suppose that the following data were obtained for a collection of archaeological sites in New Mexico: 6.00 6.50 6.75 7.50 8.50 28 20 17 30 85 Find the value of the coefficient of determination 2. O -0.703 -0.162 0.297 0.703 0.162arrow_forward
arrow_back_ios
SEE MORE QUESTIONS
arrow_forward_ios
Recommended textbooks for you
- MATLAB: An Introduction with ApplicationsStatisticsISBN:9781119256830Author:Amos GilatPublisher:John Wiley & Sons Inc
 Probability and Statistics for Engineering and th...StatisticsISBN:9781305251809Author:Jay L. DevorePublisher:Cengage Learning
 Statistics for The Behavioral Sciences (MindTap C...StatisticsISBN:9781305504912Author:Frederick J Gravetter, Larry B. WallnauPublisher:Cengage Learning
  Elementary Statistics: Picturing the World (7th E...StatisticsISBN:9780134683416Author:Ron Larson, Betsy FarberPublisher:PEARSON
 The Basic Practice of StatisticsStatisticsISBN:9781319042578Author:David S. Moore, William I. Notz, Michael A. FlignerPublisher:W. H. Freeman
 Introduction to the Practice of StatisticsStatisticsISBN:9781319013387Author:David S. Moore, George P. McCabe, Bruce A. CraigPublisher:W. H. Freeman
MATLAB: An Introduction with Applications
Statistics
ISBN:9781119256830
Author:Amos Gilat
Publisher:John Wiley & Sons Inc
Probability and Statistics for Engineering and th...
Statistics
ISBN:9781305251809
Author:Jay L. Devore
Publisher:Cengage Learning
Statistics for The Behavioral Sciences (MindTap C...
Statistics
ISBN:9781305504912
Author:Frederick J Gravetter, Larry B. Wallnau
Publisher:Cengage Learning
Elementary Statistics: Picturing the World (7th E...
Statistics
ISBN:9780134683416
Author:Ron Larson, Betsy Farber
Publisher:PEARSON
The Basic Practice of Statistics
Statistics
ISBN:9781319042578
Author:David S. Moore, William I. Notz, Michael A. Fligner
Publisher:W. H. Freeman
Introduction to the Practice of Statistics
Statistics
ISBN:9781319013387
Author:David S. Moore, George P. McCabe, Bruce A. Craig
Publisher:W. H. Freeman