ENGR.ECONOMIC ANALYSIS
14th Edition
ISBN: 9780190931919
Author: NEWNAN
Publisher: Oxford University Press
expand_more
expand_more
format_list_bulleted
Question

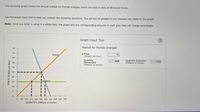
Transcribed Image Text:The following graph shows the annual market for Florida oranges, which are sold in units of 90-pound boxes.
Use the graph input tool to help you answer the following questions. You will not be graded on any changes you make to this graph.
Note: Once you enter a value in a white field, the graph and any corresponding amounts in each grey field will change accordingly.
Graph Input Tool
Market for Florida Oranges
50
45
Supply
I Price
(Dollars per box)
15
40
Quantity
Demanded
Quantity Supplied
(Millions of boxes)
406
210
35
(Millions of boxes)
30
20
15
Demand
+
0 70
140 210 280 350 420 490 560 630 700
QUANTITY (Millions of boxes)
25
10
PRICE (Dollars per box)

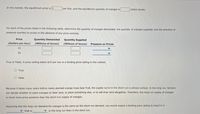
Transcribed Image Text:In this market, the equilibrium price is $
per box, and the equilibrium quantity of oranges is
million boxes.
For each of the prices listed in the following table, determine the quantity of oranges demanded, the quantity of oranges supplied, and the direction of
pressure exerted on prices in the absence of any price controls.
Price
Quantity Demanded
Quantity Supplied
(Dollars per box)
(Millions of boxes)
(Millions of boxes)
Pressure on Prices
15
35
True or False: A price ceiling below $25 per box is a binding price ceiling in this market.
O True
O False
Because it takes many years before newly planted orange trees bear fruit, the supply curve in the short run is almost vertical. In the long run, farmers
can decide whether to plant oranges on their land, to plant something else, or to sell their land altogether. Therefore, the long-run supply of oranges
is much more price sensitive than the short-run supply of oranges.
Assuming that the long-run demand for oranges is the same as the short-run demand, you would expect a binding price ceiling to result in a
that is
in the long run than in the short run.
Expert Solution
This question has been solved!
Explore an expertly crafted, step-by-step solution for a thorough understanding of key concepts.
This is a popular solution
Trending nowThis is a popular solution!
Step by stepSolved in 2 steps with 1 images

Knowledge Booster
Learn more about
Need a deep-dive on the concept behind this application? Look no further. Learn more about this topic, economics and related others by exploring similar questions and additional content below.Similar questions
- USE TABLE #1: If the price of electric automobiles dropped by 50% from the market price, the electric automobiles market would be faced with excess demand, or more specifically, a __________ (type either surplus or shortage), which means quantity __________________ (type either demanded or supplied) is greater than the quantity ____________ (type either demanded or supplied). (Spell all words correctly, choosing the correct word to fit the box)arrow_forwardExplain and illustrate each of the following statements using supply-and-demand diagrams. Show the impact on equilibrium price and quantity.i. Laptops – There is increased access to wireless technology and lighter-weight products are available. Microchips a component of laptops arecheaper as new technology has come online. [3 marks]ii. Lychee - Production in Canada totaled 1.5 million barrels in 2018, a 40percent increase from 2017. Demand increased by even more thansupply, over the same period. [3 marks]iii. Gasoline - The price of sedans rises and electric cars have become morepopular [3 marks]iv. Wool coats: New knitting machines are invented and insect infestationdestroys most of the cotton crop in Canadaarrow_forwardThe market for wool in the economy of Odessa is shown in the table below (note that quantities are given in tonnes per year). Price ($) 100 200 300 400 500 600 700 Quantity demanded 160 140 120 100 80 60 40 Quantity demanded 2 Quantity supplied 10 20 30 40 50 60 70 Quantity supplied 2 find quantity demanded 2 and quantity supplied 2 from the above tablearrow_forward
- 12. Market equilibrium and disequilibrium The following graph shows the monthly demand and supply curves in the market for calendars. Use the graph input tool to help you answer the following questions. You will not be graded on any changes you make to this graph. Note: Once you enter a value in a white field, the graph and any corresponding amounts in each grey field will change accordingly. Graph Input Tool 100 Market for Calendars 90 Price (Dollars per calendar 30 Supply Quantity Demanded (Calendars) Quantity Supplied Calendars) 500 80 50 40 Demand 100 150 200 250 300 350 400 450 800 OIANTITY Calendars 803 PM arch. PRICE (Dollars per calendar)arrow_forwardPlease use the following supply and demand schedules to answer the questions below: Price Quantity Demanded Quantity Supplied $0 4 0 $10 3 1 $20 2 2 $30 1 3 $40 0 4 a. At what prices will we see a shortage? b. At what prices will we see a surplus? c. What is the equilibrium price and quantity for this market?arrow_forward10. Price controls in the Florida orange market The following graph shows the annual market for Florida oranges, which are sold in units of 90-pound boxes. Use the graph input tool to help you answer the following questions. You will not be graded on any changes you make to this graph. Note: Once you enter a value in a white field, the graph and any corresponding amounts in each grey field will change accordingly. Graph Input Tool Market for Florida Oranges 50 I Price (Dollars per box) 45 Supply 20 40 Quantity Demanded (Millions of boxes) Quantity Supplied (Millions of boxes) 486 360 35 30 25 20 bemand 15 10 5 90 180 270 360 450 540 630 720 810 900 QUANTITY (Millions of boxes) PRICE (Dollars per box)arrow_forward
- PRICE (Dollars per gallon) Price (Dollars per gallon) 10 12 11 a 10 0 8 D 6 a 4 2 Use the data in the preceding table to plot the demand and supply curves for milk on the following graph. Use the blue points (circle symbol) to plot the demand curve. Then use the orange points (square symbol) to plot the supply curve. Line segments will automatically connect the points. ? 100 The equilibrium market price is $ The new quantity supplied is Quantity Demanded (Millions of gallons) 100 of 200 300 400 200 300 400 QUANTITY (Millions of gallons) 500 The new quantity supplied is of Quantity Supplied (Millions of gallons) 500 500 400 600 Suppose the government enacts a milk price support of $7.00 per gallon. 300 200 100 -O Demand Use the green line (triangle symbol) to plot the new price line on the preceding graph. ***]* Supply Government Price 1 Government Price 2 and the equilibrium quantity is Suppose now that the government decides to set a price ceiling of $4.00 per gallon. Use the purple…arrow_forwardUSE TABLE #1: The supply curve intersects with the price axis at $_____. (Remember to use a comma, if a comma is needed and to include the decimal point and two numbers to the right of the decimal point).arrow_forwardUse the table to answer the question. Price $3 $5 5555 $7 $9 $11 $13 $15 Quantity Demanded 70 units 160 units 250 units 200 units (units) 250 220 190 160 130 100 70 Quantity Supplied (units) 40 80 120 160 200 240 280 What is the equilibrium quantity in this market?arrow_forward
- Help please.arrow_forwardOver the past 20 years, the average price of avocados has more than doubled. Assume that the price of avocados is determined by the forces of supply and demand. Using concepts that you have learned about supply and demand, explain whether the following is or is not a cause of the increase in price of avocado. Restrictions on imports of avocados from Mexico were gradually lifted. Improved production methods allowed for slower ripening of avocados and therefore more avocados can be reliably shipped. Mexican food, which regularly features avocados, has become more popular.arrow_forwardConsider the world market for wheat, in which Russia is a larger producer. Suppose there is a major failure in Russia's wheat crop due to a severe drought. Explain the likely effect on the equilibrium price and quantity in the world wheat market. Also, explain why Canadian wheat farmers certainly benefit from this droughtarrow_forward
arrow_back_ios
SEE MORE QUESTIONS
arrow_forward_ios
Recommended textbooks for you

 Principles of Economics (12th Edition)EconomicsISBN:9780134078779Author:Karl E. Case, Ray C. Fair, Sharon E. OsterPublisher:PEARSON
 Engineering Economy (17th Edition)EconomicsISBN:9780134870069Author:William G. Sullivan, Elin M. Wicks, C. Patrick KoellingPublisher:PEARSON
 Principles of Economics (MindTap Course List)EconomicsISBN:9781305585126Author:N. Gregory MankiwPublisher:Cengage Learning
 Managerial Economics: A Problem Solving ApproachEconomicsISBN:9781337106665Author:Luke M. Froeb, Brian T. McCann, Michael R. Ward, Mike ShorPublisher:Cengage Learning
 Managerial Economics & Business Strategy (Mcgraw-...EconomicsISBN:9781259290619Author:Michael Baye, Jeff PrincePublisher:McGraw-Hill Education


Principles of Economics (12th Edition)
Economics
ISBN:9780134078779
Author:Karl E. Case, Ray C. Fair, Sharon E. Oster
Publisher:PEARSON

Engineering Economy (17th Edition)
Economics
ISBN:9780134870069
Author:William G. Sullivan, Elin M. Wicks, C. Patrick Koelling
Publisher:PEARSON

Principles of Economics (MindTap Course List)
Economics
ISBN:9781305585126
Author:N. Gregory Mankiw
Publisher:Cengage Learning

Managerial Economics: A Problem Solving Approach
Economics
ISBN:9781337106665
Author:Luke M. Froeb, Brian T. McCann, Michael R. Ward, Mike Shor
Publisher:Cengage Learning

Managerial Economics & Business Strategy (Mcgraw-...
Economics
ISBN:9781259290619
Author:Michael Baye, Jeff Prince
Publisher:McGraw-Hill Education