
MATLAB: An Introduction with Applications
6th Edition
ISBN: 9781119256830
Author: Amos Gilat
Publisher: John Wiley & Sons Inc
expand_more
expand_more
format_list_bulleted
Related questions
Topic Video
Question
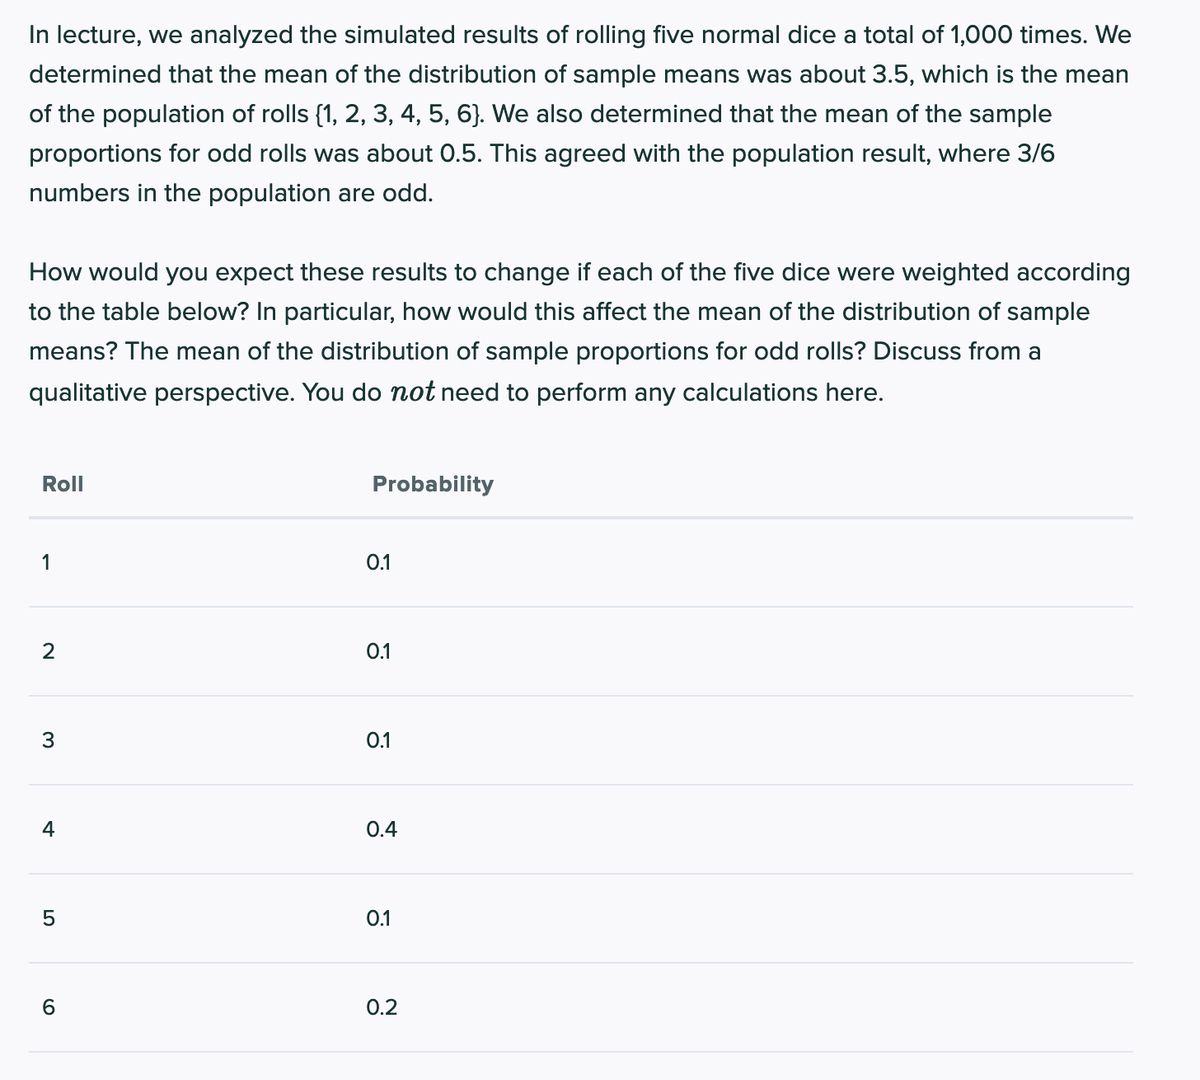

Transcribed Image Text:In lecture, we analyzed the simulated results of rolling five normal dice a total of 1,000 times. We
determined that the mean of the distribution of sample means was about 3.5, which is the mean
of the population of rolls {1, 2, 3, 4, 5, 6}. We also determined that the mean of the sample
proportions for odd rolls was about 0.5. This agreed with the population result, where 3/6
numbers in the population are odd.
How would you expect these results to change if each of the five dice were weighted according
to the table below? In particular, how would this affect the mean of the distribution of sample
means? The mean of the distribution of sample proportions for odd rolls? Discuss from a
qualitative perspective. You do not need to perform any calculations here.
Roll
Probability
1
0.1
2
0.1
3
0.1
4
0.4
0.1
6.
0.2
Expert Solution
This question has been solved!
Explore an expertly crafted, step-by-step solution for a thorough understanding of key concepts.

Step by stepSolved in 2 steps with 1 images

Knowledge Booster


Learn more about
Need a deep-dive on the concept behind this application? Look no further. Learn more about this topic, statistics and related others by exploring similar questions and additional content below.Similar questions
- A random sample of size 1,000 is taken from a population where the population proportion p = .02. What is the mean of the sample proportions?arrow_forwardOn average, a sample of n = 36 scores will provide a better estimate of the population mean than a sample of n = 49 scores from the same population.arrow_forwardSuppose that you had collected the following sample data (in inches) on the diameters of tree trunks, measured at waist level and growing at 2000’ elevation in the Cascade Mountains: 9.0, 6.2, 6.5, 7.0, 10.5 and 8.8. The sample Inter Quartile Range is: (a) 5.5 (b) 4.5 (c) 3.5 (d) 2.5 (e) 4.0 (f) None of the abovearrow_forward
- A survey of 2255 randomly selected US adults found that 51% said they know all or most of their neighbors. Find 90% CI for the proportion of US adults they know most or all their neighbors. The sample size of 200 is large enough to use a normal distribution.arrow_forwardThe population mean will always be the same as the mean of all possible that can be computed from samples of size 27. True O Falsearrow_forwardSuppose I want to sample the household incomes for EBR parish. Let's say I start with a simple random sample of 100 residents and calculate the sample mean. How would the sampling distribution of change if I increase the sample size to 1,000 residents?arrow_forward
- The best way to ensure that your sample represents the population it came from accurately, is to make sure you have a sample of at least 10. (n=10) True or falsearrow_forwardPavan.88.9arrow_forwardSuppose the percentage of married couples who own a home is 33% for a given population. What is the standard error of the sampling distribution of proportions for the sample sizes n = 200, n = 300, and n = 400?arrow_forward
arrow_back_ios
arrow_forward_ios
Recommended textbooks for you
- MATLAB: An Introduction with ApplicationsStatisticsISBN:9781119256830Author:Amos GilatPublisher:John Wiley & Sons Inc
 Probability and Statistics for Engineering and th...StatisticsISBN:9781305251809Author:Jay L. DevorePublisher:Cengage Learning
 Statistics for The Behavioral Sciences (MindTap C...StatisticsISBN:9781305504912Author:Frederick J Gravetter, Larry B. WallnauPublisher:Cengage Learning
  Elementary Statistics: Picturing the World (7th E...StatisticsISBN:9780134683416Author:Ron Larson, Betsy FarberPublisher:PEARSON
 The Basic Practice of StatisticsStatisticsISBN:9781319042578Author:David S. Moore, William I. Notz, Michael A. FlignerPublisher:W. H. Freeman
 Introduction to the Practice of StatisticsStatisticsISBN:9781319013387Author:David S. Moore, George P. McCabe, Bruce A. CraigPublisher:W. H. Freeman
MATLAB: An Introduction with Applications
Statistics
ISBN:9781119256830
Author:Amos Gilat
Publisher:John Wiley & Sons Inc
Probability and Statistics for Engineering and th...
Statistics
ISBN:9781305251809
Author:Jay L. Devore
Publisher:Cengage Learning
Statistics for The Behavioral Sciences (MindTap C...
Statistics
ISBN:9781305504912
Author:Frederick J Gravetter, Larry B. Wallnau
Publisher:Cengage Learning
Elementary Statistics: Picturing the World (7th E...
Statistics
ISBN:9780134683416
Author:Ron Larson, Betsy Farber
Publisher:PEARSON
The Basic Practice of Statistics
Statistics
ISBN:9781319042578
Author:David S. Moore, William I. Notz, Michael A. Fligner
Publisher:W. H. Freeman
Introduction to the Practice of Statistics
Statistics
ISBN:9781319013387
Author:David S. Moore, George P. McCabe, Bruce A. Craig
Publisher:W. H. Freeman