MATLAB: An Introduction with Applications
6th Edition
ISBN: 9781119256830
Author: Amos Gilat
Publisher: John Wiley & Sons Inc
expand_more
expand_more
format_list_bulleted
Question

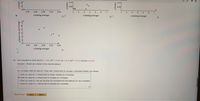
Transcribed Image Text:U.28
U.28
0.26
0.26
0.26
0.28
0.30
0.32
0.34
1
2
3
4 5 6 7
1
2
4
5 6 7
x (batting average)
x (batting average)
x (batting average)
6
0.26
0.28
0.30
0.32
0.34
x (batting average)
(b) Use a calculator to verify that Ex
1.955, Σχ-0.552, Σy-29.5, Σy
= 147.33 and Exy = 8.578.
%3D
Compute r. (Round your answer to four decimal places.)
As x increases, does the value of r imply that y should tend to increase or decrease? Explain your answer.
Given our value of r, y should tend to remain constant as x increases.
Given our value of r, y should tend to increase as x increases.
Given our value of r, we can not draw any conclusions for the behavior of y as x increases.
Given our value of r, y should tend to decrease as x increases.
Need Help?
Read It
Watch It
y (home
3,
y (home run percentage)
4)
2.
3.
2.
y(home
y (home

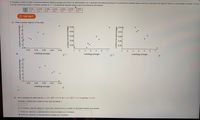
Transcribed Image Text:In baseball, is there a linear correlation between batting average and home run percentage? Let x represent the batting average of a professional baseball player, and let y represent the player's home run percentage (number of home
runs per 100 times at bat). A random sample of n = 7 professional baseball players gave the following information.
%3D
0.251
0.249
0.286
0.263
0.268
0.339
0.299
1.1
3.3
5.5
3.8
3.5
7.3
5.0
A USE SALT
(a) Make a scatter diagram of the data.
0.34
0.34
0.32
0.32
0.30
0.30
0.28
0.28
0.26
0.26
0.26
0.28
0.30
0.32
0.34
1
2
3 4
7
1
3
4
5 6 7
x (batting average)
x (batting average)
x (batting average)
0.26
0.28
0.30
0.32
0.34
x (batting average)
(b) Use a calculator to verify that Ex = 1.955, Ex = 0.552, Ey
29.5, Ey = 147.33 and Exy 8.578.
Compute r. (Round your answer to four decimal places.)
As x increases, does the value of r imply that y should tend to increase or decrease? Explain your answer.
Given ou
value of r, y should tend to remain constant as x increases.
Given our value of r, y should tend to increase as x increases.
y (home run percentage)
Expert Solution
This question has been solved!
Explore an expertly crafted, step-by-step solution for a thorough understanding of key concepts.
Step by stepSolved in 2 steps with 1 images

Knowledge Booster
Similar questions
- Which of the following choices could be the Pearson correlation between the x and y variables shown in the scatter plot shown here? a) .934 b) -.934 c) 1 d) 0arrow_forwardIn baseball, is there a linear correlation between batting average and home run percentage? Let x represent the batting average of a professional baseball player, and let y represent the player's home run percentage (number of home runs per 100 times at bat). A random sample of n = 7 professional baseball players gave the following information. 0.235 0.245 0.286 0.263 0.268 0.339 0.299 1.3 3.4 5.5 3.8 3.5 7.3 5.0 A USE SALT (a) Make a scatter diagram of the data. Graph Layers After you add an object to the graph you can use Graph Layers to view and edit its properties. Fill No Solution 2 OHelp 123 0.24 0.25 026 027 028 029 0.3 031 0.32 0.33 WebAssign. Graphing Tool (b) Use a calculator to verify that Ex = 1.935, Ex² = 0.542, Ey = 29.8, Ey2 = 148.48 and Exy = 8.619. Compute r. (Round your answer to four decimal places.) As x increases, does the value of r imply that y should tend to increase or decrease? Explain your answer. O Given our value of r, y should tend to decrease as x…arrow_forwardPerform rank correlation analysis on the following data set: x y -5 1.9 -4 0.9 -3.25 0.7 -2.55 -0.5 -1.85 -1.2 -0.9 -1.7 5.5511151231258E-17 0.7 0.8 1.5 1.55 1.6 2.35 -0.1 3.3 0.8 4.1 -1.1 5.1 -0.9 5.8 -0.8 6.7 0.7 What is the rank correlation coefficient? (Round to three decimal places.) What is the critical rho value at a 0.01 significance? Do we have correlation? Yes, the rank correlation coefficient is smaller (in absolute value) than the critical rho value. No, the rank correlation coefficient is larger (in absolute value) than the critical rho value. No, the rank correlation coefficient is smaller (in absolute value) than the critical rho value. Yes, the rank correlation coefficient is larger (in absolute value) than the critical rho value.arrow_forward
- Use Spearman rho formula to determine if there is a correlation between the English and Math score of 10 students English 86 76 46 71 82 64 58 80 75 61 Math 66 80 40 60 65 56 58 77 67 81 Ho: Ha: Calculated Value: Tabulated Value: Decision: Conclusion:arrow_forwardTo examine the linear correlation between adult age and weight, data was collected from 9 adults. See the table below. Age Weight (Years) (pounds) 26 203 28 245 29 141 34 139 39 199 40 194 41 137 50 181 52 197 Does this result suggest that the correlation is statistically significant? Use a = 0.01. Important Note: Round your value for r to three decimals before computing the STS. DO NOT use the built- in LinRegTTest on a calculator because you might get marked wrong. When computing the P-value, use the rounded STS. 1. Select the correct statement: O f the correlation is found to be statistically significant, that means that changes in æ cause changes in y O Even if the correlation is found to be statistically significant, that does not necessarily mean that changes in æ cause changes in yarrow_forwardWhich of the following is necessary to estimate the population parameter of a Pearson's correlation coeffcient properly? A. A curvilinear relationship B. Nominal Data C. Random sampling D. Ranked scoresarrow_forward
- A study was done to look at the relationship between number of partners college students have had in their lifetimes and their GPAs. The results of the survey are shown below. Partners 7 8 6 1 6 6 4 GPA 1.4 1.5 1.4 3 2.3 1.5 2.9 Find the correlation coefficient: r=r= Round to 2 decimal places. The null and alternative hypotheses for correlation are:H0:H0: ? r ρ μ Incorrect == 0 Ha:Ha: ? r ρ μ Incorrect ≠≠ 0 Use a level of significance of α=0.05α=0.05 to state the conclusion of the hypothesis test in the context of the study. You may want to reference the 95% Critical Values of the Sample Correlation Coefficient. There is statistically insignificant evidence to conclude that there is a correlation between the number of partners students have had in their lifetimes and their GPA. Thus, the use of the regression line is not appropriate. There is statistically significant evidence to conclude that a student who has had more partners will have a lower GPA than a…arrow_forwardThe accompanying data are x = advertising share and y = market share for a particular brand of soft drink during 10 randomly selected years. x 0.104 0.072 0.072 0.077 0.086 0.047 0.060 0.050 0.070 0.052 y 0.137 0.127 0.120 0.086 0.079 0.076 0.065 0.059 0.051 0.039 b)Calculate the equation of the estimated regression line. (Round your answers to four decimal places.) d)Calculate a point estimate of ?e. (Round your answer to five decimal places.)arrow_forwardThe following table compares the completion percentage and interception percentage of 55 NFL quarterbacks. Completion Percentage 58 59 62 65 66 Interception Percentage 4.5 4 3 2.5 1.5 Copy Data Determine if r is statistically significant at the 0.01 level. Yes or No? the correlation coefficient is/ is not statistically significant.arrow_forward
- In baseball, is there a linear correlation between batting average and home run percentage? Let x represent the batting average of a professional baseball player, and let y represent the player's home run percentage (number of home runs per 100 times at bat). A random sample of n = 7 professional baseball players gave the following information. x 0.243 0.245 0.286 0.263 0.268 0.339 0.299 y 1.0 3.3 5.5 3.8 3.5 7.3 5.0 A) Compute r. (Round your answer to three decimal places.) B) As x increases, does the value of r imply that y should tend to increase or decrease? Explain your answer.arrow_forwardLet x be the average number of employees in a group health insurance plan, and let y be theaverage administrative cost as a percentage of claims. The following data is based on a randomsample:x 5 7 15 25 35y 40 35 30 20 25a. Plot a scatter diagram of the above data.b. Estimate the sample correlation coefficient r as positive, zero, or negative.c. Interpret your results from parts a. and b.arrow_forwardIn baseball, is there a linear correlation between batting average and home run percentage? Let x represent the batting average of a professional baseball player, and let y represent the player's home run percentage (number of home runs per 100 times at bat). A random sample of n = 7 professional baseball players gave the following information. x0.241 0.263 3.8 0.261 0.286 0.268 3.5 0.339 0.299 y 1.1 3.3 5.5 7.3 5.0 (a) Make a scatter diagram of the data. Graph Layers After you add an object to the graph you can use Graph Layers to view and edit its properties. WebAssign. Graphing Too (b) Use a calculator to verify that Ex = 1.957, Ex2 = 0.553, Ey = 29.5, Ey2 = 147.33 and Exy = 8.607. Compute r. (Round your answer to three decimal places.) As x increases, does the value of r imply that y should tend to increase or decrease? Explain your answer. O Given our value of r, y should tend to decrease as x increases. O Given our value of r, y should tend to remain constant as x increases.…arrow_forward
arrow_back_ios
arrow_forward_ios
Recommended textbooks for you
 MATLAB: An Introduction with ApplicationsStatisticsISBN:9781119256830Author:Amos GilatPublisher:John Wiley & Sons Inc
 Probability and Statistics for Engineering and th...StatisticsISBN:9781305251809Author:Jay L. DevorePublisher:Cengage Learning
 Statistics for The Behavioral Sciences (MindTap C...StatisticsISBN:9781305504912Author:Frederick J Gravetter, Larry B. WallnauPublisher:Cengage Learning
 Elementary Statistics: Picturing the World (7th E...StatisticsISBN:9780134683416Author:Ron Larson, Betsy FarberPublisher:PEARSON
 The Basic Practice of StatisticsStatisticsISBN:9781319042578Author:David S. Moore, William I. Notz, Michael A. FlignerPublisher:W. H. Freeman
 Introduction to the Practice of StatisticsStatisticsISBN:9781319013387Author:David S. Moore, George P. McCabe, Bruce A. CraigPublisher:W. H. Freeman

MATLAB: An Introduction with Applications
Statistics
ISBN:9781119256830
Author:Amos Gilat
Publisher:John Wiley & Sons Inc

Probability and Statistics for Engineering and th...
Statistics
ISBN:9781305251809
Author:Jay L. Devore
Publisher:Cengage Learning

Statistics for The Behavioral Sciences (MindTap C...
Statistics
ISBN:9781305504912
Author:Frederick J Gravetter, Larry B. Wallnau
Publisher:Cengage Learning

Elementary Statistics: Picturing the World (7th E...
Statistics
ISBN:9780134683416
Author:Ron Larson, Betsy Farber
Publisher:PEARSON

The Basic Practice of Statistics
Statistics
ISBN:9781319042578
Author:David S. Moore, William I. Notz, Michael A. Fligner
Publisher:W. H. Freeman

Introduction to the Practice of Statistics
Statistics
ISBN:9781319013387
Author:David S. Moore, George P. McCabe, Bruce A. Craig
Publisher:W. H. Freeman