MATLAB: An Introduction with Applications
6th Edition
ISBN: 9781119256830
Author: Amos Gilat
Publisher: John Wiley & Sons Inc
expand_more
expand_more
format_list_bulleted
Question

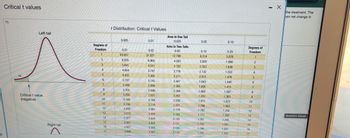
Transcribed Image Text:8
Critical t values
a
Left tail
Critical t value
(negative)
Right tail
Degrees of
Freedom
1
2
3
4
5
6
7
8
20
9
.
10
11
12
13
14
15
16
17
t Distribution: Critical t Values
0.005
0.01
63.657
9.925
5.841
4.604
4.032
3.707
3.499
3.355
3.250
3:200
3.169
3.106
3.055
3.012
2.977
2.947
2.921
2.898
0.01
0.02
31.821
6.965
4.541
3.747
3.365
3.143
2.998
2:350
2:090
2.896
2.821
LIVE!
2.764
2.704
2.718
2.110
2.681
2.650
2.624
2.602
2.583
2.567
Area in One Tail
0.025
Area in Two Tails
0.05
12.706
4.303
3.182
2.776
2.571
2.447
2.365
2.309
2.306
2.262
2.228
2.201
2.179
2.119
2.160
2.145
2.131
2.120
2.110
0.05
0.10
6.314
2.920
2.353
2.132
2.015
1.943
1.895
1.860
1.833
1.812
1.796
1.782
1.782
1.771
1.761
1.753
1.746
1.740
CAL
0.10
0.20
3.078
1.886
1.638
1.533
1.476
1.440
1.415
1.397
1.383
1.372
1.363
1.356
1.350
1.350
1.345
1.341
1.337
1.333
Degrees of
Freedom
1
2
14
15
16
17
10
11
12
13
-
5
6
7
7
.
8
3
4
9
- X
the treatment. The
an net change in
Question Viewer

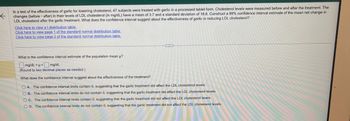
Transcribed Image Text:In a test of the effectiveness of garlic for lowering cholesterol, 47 subjects were treated with garlic in a processed tablet form. Cholesterol levels were measured before and after the treatment. The
←
changes (before-after) in their levels of LDL cholesterol (in mg/dL) have a mean of 3.7 and a standard deviation of 18.8. Construct a 99% confidence interval estimate of the mean net change in
LDL cholesterol after the garlic treatment. What does the confidence interval suggest about the effectiveness of garlic in reducing LDL cholesterol?
Click here to view a t distribution table.
Click here to view page 1 of the standard normal distribution table.
Click here to view page 2 of the standard normal distribution table.
What is the confidence interval estimate of the population mean μ?
mg/dL. <μ< mg/dL
(Round to two decimal places as needed.).
What does the confidence interval suggest about the effectiveness of the treatment?
...
OA. The confidence interval limits contain 0, suggesting that the garlic treatment did affect the LDL cholesterol levels.
OB. The confidence interval limits do not contain 0, suggesting that the garlic treatment did affect the LDL cholesterol levels.
OC. The confidence interval limits contain 0, suggesting that the garlic treatment did not affect the LDL cholesterol levels.
OD. The confidence interval limits do not contain 0, suggesting that the garlic treatment did not affect the LDL cholesterol levels.
Expert Solution
arrow_forward
Step 1
Given:
Sample size n = 47
Sample mean = 3.7
Standard deviation sd = 18.8
Confidence level = 99%
Formula Used:
Step by stepSolved in 4 steps with 2 images

Knowledge Booster
Similar questions
- In a test of the effectiveness of garlic for lowering cholesterol, 44 subjects were treated with garlic in a processed tablet form. Cholesterol levels were measured before and after the treatment. The changes (before−after) in their levels of LDL cholesterol (in mg/dL) have a mean of 5.7 and a standard deviation of 17.7. Construct a 90% confidence interval estimate of the mean net change in LDL cholesterol after the garlic treatment. What does the confidence interval suggest about the effectiveness of garlic in reducing LDL cholesterol? What is the confidence interval estimate of the population mean μ? ____mg/dL<μ<_____mg/dLarrow_forwardIn a test of the effectiveness of garlic for lowering cholesterol, 47 subjects were treated with garlic in a processed tablet form. Cholesterol levels were measured before and after the treatment. The changes (before−after) in their levels of LDL cholesterol (in mg/dL) have a mean of 2.8 and a standard deviation of 16.3. Construct a 90% confidence interval estimate of the mean net change in LDL cholesterol after the garlic treatment. What does the confidence interval suggest about the effectiveness of garlic in reducing LDL cholesterol?arrow_forwardIn a test of the effectiveness of garlic for lowering cholesterol, 42 subjects were treated with garlic in a processed tablet form. Cholesterol levels were measured before and after the treatment. The changes (before−after) in their levels of LDL cholesterol (in mg/dL) have a mean of 3.5 and a standard deviation of 15.4. Construct a 95% confidence interval estimate of the mean net change in LDL cholesterol after the garlic treatment. What does the confidence interval suggest about the effectiveness of garlic in reducing LDL cholesterol?arrow_forward
- In a test of the effectiveness of garlic for lowering cholesterol, 48 subjects were treated with garlic in a processed tablet form. Cholesterol levels were measured before and after the treatment. The changes (before−after) in their levels of LDL cholesterol (in mg/dL) have a mean of 4.1 and a standard deviation of 16.5. Construct a 99% confidence interval estimate of the mean net change in LDL cholesterol after the garlic treatment. What does the confidence interval suggest about the effectiveness of garlic in reducing LDL cholesterol? Click here to view a t distribution table. LOADING...arrow_forwardIn a test of the effectiveness of garlic for lowering cholesterol, 42 subjects were treated with garlic in a processed tablet form. Cholesterol levels were measured before and after the treatment. The changes (before - after) in their levels of LDL cholesterol (in mg/dL) have a mean of 2.0 and a standard deviation of 16.5. Construct a 99% confidence interval estimate of the mean net change in LDL cholesterol after the garlic treatment. What does the confidence interval suggest about the effectiveness of garlic in reducing LDL cholesterol?arrow_forwardIn a test of the effectiveness of garlic for lowering cholesterol, 47 subjects were treated with garlic in a processed tablet form. Cholesterol levels were measured before and after the treatment. The changes (before−after) in their levels of LDL cholesterol (in mg/dL) have a mean of 5.6 and a standard deviation of 16.2. Construct a 90% confidence interval estimate of the mean net change in LDL cholesterol after the garlic treatment. What does the confidence interval suggest about the effectiveness of garlic in reducing LDL cholesterol? 1) What is the confidence interval estimate of the population mean μ? nothing mg/dL<μ< nothing mg/dL 2) What does the confidence interval suggest about the effectiveness of garlic in reducing LDL cholesterol?arrow_forward
- In a test of the effectiveness of garlic for lowering cholesterol, 48 subjects were treated with garlic in a processed tablet form. Cholesterol levels were measured before and after the treatment. The changes (before−after) in their levels of LDL cholesterol (in mg/dL) have a mean of 5.3 and a standard deviation of 17.4. Construct a 90% confidence interval estimate of the mean net change in LDL cholesterol after the garlic treatment. What does the confidence interval suggest about the effectiveness of garlic in reducing LDL cholesterol? . What is the confidence interval estimate of the population mean μ? enter your response here mg/dL<μ<enter your response here mg/dL (Round to two decimal places as needed.)arrow_forwardIn a test of the effectiveness of garlic for lowering cholesterol, 48 subjects were treated with garlic in a processed tablet form. Cholesterol levels were measured before and after the treatment. The changes (before−after) in their levels of LDL cholesterol (in mg/dL) have a mean of 3.7 and a standard deviation of 17.8. Construct a 90% confidence interval estimate of the mean net change in LDL cholesterol after the garlic treatment. What does the confidence interval suggest about the effectiveness of garlic in reducing LDL cholesterol?arrow_forwardIn a test of the effectiveness of garlic for lowering cholesterol, 45 subjects were treated with garlic in a processed tablet form. Cholesterol levels were measured before and after the treatment. The changes (beforeafter) in their levels of LDL cholesterol (in mg/dL) have a mean of 3.8 and a standard deviation of 19.2. Construct a 95% confidence interval estimate of the mean net change in LDL cholesterol after the garlic treatment. What does the confidence interval suggest about the effectiveness of garlic in reducing LDL cholesterol?arrow_forward
- In a test of the effectiveness of garlic for lowering cholesterol, 49 subjects were treated with garlic in a processed tablet form. Cholesterol levels were measured before and after the treatment. The changes (before−after) in their levels of LDL cholesterol (in mg/dL) have a mean of 3.2 and a standard deviation of 19.3. Construct a 90% confidence interval estimate of the mean net change in LDL cholesterol after the garlic treatment. What does the confidence interval suggest about the effectiveness of garlic in reducing LDL cholesterol? What is the confidence interval estimate of the population mean μ? ___mg/dL<μ<____mg/dL (Round to two decimal places as neededarrow_forwardIn a test of the effectiveness of garlic for lowering cholesterol, 42 subjects were treated with garlic in a processed tablet form. Cholesterol levels were measured before and after the treatment. The changes (before - after) in their levels of LDL cholesterol (in mg/dL) have a mean of 4.1 and a standard deviation of 19.1. Construct a 99% confidence interval estimate of the mean net change in LDL cholesterol after the garlic treatment. What does the confidence interval suggest about the effectiveness of garlic in reducing LDL cholesterol? Click here to view at distribution table. Click here to view page 1 of the standard normal distribution table, Click here to view page 2 of the standard normal distribution table. What is the confidence interval estimate of the population mean u? mg/dL < µarrow_forwardIn a test of the effectiveness of garlic for lowering cholesterol, 45 subjects were treated with garlic in a processed tablet form. Cholesterol levels were measured before and after the treatment. The changes (before−after)in their levels of LDL cholesterol (in mg/dL) have a mean of 4.6 and a standard deviation of 16.3. Construct a 95% confidence interval estimate of the mean net change in LDL cholesterol after the garlic treatment. What does the confidence interval suggest about the effectiveness of garlic in reducing LDL cholesterol? What is the confidence interval estimate of the population mean μ? ______ mg/dL<μ<_____ mg/dL (Round to two decimal places as needed.) What does the confidence interval suggest about the effectiveness of the treatment? A. The confidence interval limits contain 0, suggesting that the garlic treatment did not affect the LDL cholesterol levels. B. The confidence interval limits contain 0, suggesting that the garlic treatment…arrow_forwardarrow_back_iosSEE MORE QUESTIONSarrow_forward_ios
Recommended textbooks for you
 MATLAB: An Introduction with ApplicationsStatisticsISBN:9781119256830Author:Amos GilatPublisher:John Wiley & Sons Inc
 Probability and Statistics for Engineering and th...StatisticsISBN:9781305251809Author:Jay L. DevorePublisher:Cengage Learning
 Statistics for The Behavioral Sciences (MindTap C...StatisticsISBN:9781305504912Author:Frederick J Gravetter, Larry B. WallnauPublisher:Cengage Learning
 Elementary Statistics: Picturing the World (7th E...StatisticsISBN:9780134683416Author:Ron Larson, Betsy FarberPublisher:PEARSON
 The Basic Practice of StatisticsStatisticsISBN:9781319042578Author:David S. Moore, William I. Notz, Michael A. FlignerPublisher:W. H. Freeman
 Introduction to the Practice of StatisticsStatisticsISBN:9781319013387Author:David S. Moore, George P. McCabe, Bruce A. CraigPublisher:W. H. Freeman

MATLAB: An Introduction with Applications
Statistics
ISBN:9781119256830
Author:Amos Gilat
Publisher:John Wiley & Sons Inc

Probability and Statistics for Engineering and th...
Statistics
ISBN:9781305251809
Author:Jay L. Devore
Publisher:Cengage Learning

Statistics for The Behavioral Sciences (MindTap C...
Statistics
ISBN:9781305504912
Author:Frederick J Gravetter, Larry B. Wallnau
Publisher:Cengage Learning

Elementary Statistics: Picturing the World (7th E...
Statistics
ISBN:9780134683416
Author:Ron Larson, Betsy Farber
Publisher:PEARSON

The Basic Practice of Statistics
Statistics
ISBN:9781319042578
Author:David S. Moore, William I. Notz, Michael A. Fligner
Publisher:W. H. Freeman

Introduction to the Practice of Statistics
Statistics
ISBN:9781319013387
Author:David S. Moore, George P. McCabe, Bruce A. Craig
Publisher:W. H. Freeman