
Glencoe Algebra 1, Student Edition, 9780079039897, 0079039898, 2018
18th Edition
ISBN: 9780079039897
Author: Carter
Publisher: McGraw Hill
expand_more
expand_more
format_list_bulleted
Related questions
Topic Video
Question
In a test of the effectiveness of garlic for lowering cholesterol,
mean of
interval estimate of the mean net change in LDL cholesterol after the garlic treatment. What does the confidence interval suggest about the effectiveness of garlic in reducing LDL cholesterol?
48
subjects were treated with garlic in a processed tablet form. Cholesterol levels were measured before and after the treatment. The changes
(before−after)
in their levels of LDL cholesterol (in mg/dL) have a 4.1
and a standard deviation of
16.5.
Construct a
99%
confidence Click here to view a t distribution table.
LOADING...
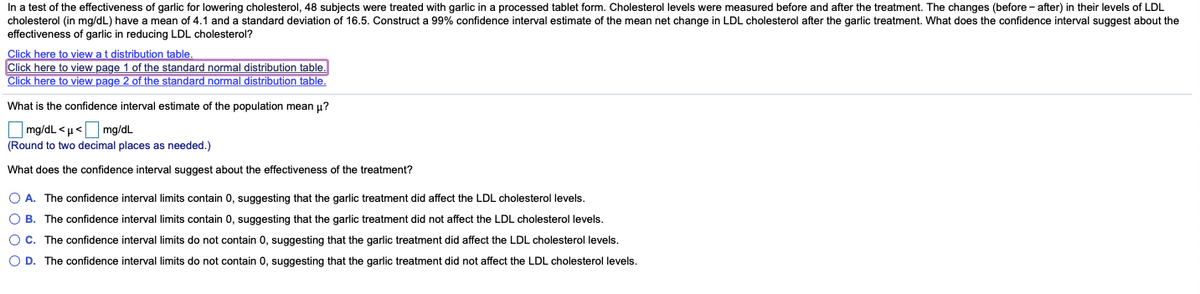

Transcribed Image Text:In a test of the effectiveness of garlic for lowering cholesterol, 48 subjects were treated with garlic in a processed tablet form. Cholesterol levels were measured before and after the treatment. The changes (before - after) in their levels of LDL
cholesterol (in mg/dL) have a mean of 4.1 and a standard deviation of 16.5. Construct a 99% confidence interval estimate of the mean net change in LDL cholesterol after the garlic treatment. What does the confidence interval suggest about the
effectiveness of garlic in reducing LDL cholesterol?
Click here to view a t distribution table.
Click here to view page 1 of the standard normal distribution table.
Click here to view page 2 of the standard normal distribution table.
What is the confidence interval estimate of the population mean u?
mg/dL <µ< mg/dL
(Round to two decimal places as needed.)
What does the confidence interval suggest about the effectiveness of the treatment?
O A. The confidence interval limits contain 0, suggesting that the garlic treatment did affect the LDL cholesterol levels.
O B. The confidence interval limits contain 0, suggesting that the garlic treatment did not affect the LDL cholesterol levels.
OC. The confidence interval limits do not contain 0, suggesting that the garlic treatment did affect the LDL cholesterol levels.
O D. The confidence interval limits do not contain 0, suggesting that the garlic treatment did not affect the LDL cholesterol levels.
Expert Solution
This question has been solved!
Explore an expertly crafted, step-by-step solution for a thorough understanding of key concepts.

This is a popular solution

Trending nowThis is a popular solution!

Step by stepSolved in 2 steps with 3 images

Knowledge Booster


Learn more about
Need a deep-dive on the concept behind this application? Look no further. Learn more about this topic, statistics and related others by exploring similar questions and additional content below.Similar questions
- Low-density lipoprotein, or LDL, is the main source of cholesterol buildup and blockage in the arteries. This is why LDL is known as "bad cholesterol." LDL is measured in milligrams per deciliter of blood, or mg/dL. In a population of adults at risk for cardiovascular problems, the distribution of LDL levels is normal, with a mean of 123 mg/dL and a standard deviation of 41 mg/dL. If an individual's LDL is at least 1 standard deviation or more above the mean, he or she will be monitored carefully by a doctor. What percentage of individuals from this population will have LDL levels 1 or more standard deviations above the mean? Use the 68–95–99.7 rule. (Enter your exact answer as a whole number.) percentage %arrow_forwardIn a test of the effectiveness of garlic for lowering cholesterol, 36subjects were treated with raw garlic. Cholesterol levels were measured before and after the treatment. The changes (before minus after) in their levels of LDL cholesterol (in mg/dL) have a mean of 0.3 and a standard deviation of 2.39. Use a 0.01 significance level to test the claim that with garlic treatment, the mean change in LDL cholesterol is greater than 0. What do the results suggest about the effectiveness of the garlic treatment? Assume that a simple random sample has been selected. Identify the null and alternative hypotheses, test statistic, P-value, and state the final conclusion that addresses the original claim.arrow_forwardIn a test of the effectiveness of garlic for lowering cholesterol, 49subjects were treated with raw garlic. Cholesterol levels were measured before and after the treatment. The changes (before minus after) in their levels of LDL cholesterol (in mg/dL) have a mean of 0.6 and a standard deviation of 2.46. Use a 0.01 significance level to test the claim that with garlic treatment, the mean change in LDL cholesterol is greater than 0. What do the results suggest about the effectiveness of the garlic treatment? Assume that a simple random sample has been selected. Identify the null and alternative hypotheses, test statistic, P-value, and state the final conclusion that addresses the original claim. Determine the test statistic. Determine the P-value.arrow_forward
- Low‑density lipoprotein, or LDL, is the main source of cholesterol buildup and blockage in the arteries. This is why LDL is known as "bad cholesterol." LDL is measured in milligrams per deciliter of blood, or mg/dL. In a population of adults at risk for cardiovascular problems, the distribution of LDL levels is normal, with a mean of 123 mg/dL and a standard deviation of 41 mg/dL. If an individual's LDL is at least 1 standard deviation or more above the mean, he or she will be monitored carefully by a doctor. What percentage of individuals from this population will have LDL levels 1 or more standard deviations above the mean? Use the 68–95–99.7% rule.arrow_forwardArsenic occurs naturally in some ground water and can be toxic. A mean arsenic level of μ=9 parts per billion (ppb) is considered safe for agricultural use. A well in San Bernardino County is used to water strawberry crops. This well is tested on a regular basis for arsenic. A random sample of 42 tests gave a sample mean of 8.5 ppb arsenic, with a sample standard deviation of 2.1 ppb. Does this information indicate that the mean level of arsenic in this well is less than μ=9ppb? Use α=0.005 What is the level of significance? State the null and alternate hypotheses. H0:H0:? σ p μ χ Select an answer < > = ≠ ppbH1:H1:? μ p χ σ Select an answer > = ≠ < ppb What is the value of the test statistic? (Round your answer to two decimal places.)Find the P-value. (Round your answer to four decimal places.)arrow_forwardFind the critical value for a test for correlation with α = 0.05 for a sample size of 21.arrow_forward
arrow_back_ios
arrow_forward_ios
Recommended textbooks for you
- Glencoe Algebra 1, Student Edition, 9780079039897...AlgebraISBN:9780079039897Author:CarterPublisher:McGraw Hill
 Big Ideas Math A Bridge To Success Algebra 1: Stu...AlgebraISBN:9781680331141Author:HOUGHTON MIFFLIN HARCOURTPublisher:Houghton Mifflin Harcourt
Glencoe Algebra 1, Student Edition, 9780079039897...
Algebra
ISBN:9780079039897
Author:Carter
Publisher:McGraw Hill
Big Ideas Math A Bridge To Success Algebra 1: Stu...
Algebra
ISBN:9781680331141
Author:HOUGHTON MIFFLIN HARCOURT
Publisher:Houghton Mifflin Harcourt