
MATLAB: An Introduction with Applications
6th Edition
ISBN: 9781119256830
Author: Amos Gilat
Publisher: John Wiley & Sons Inc
expand_more
expand_more
format_list_bulleted
Related questions
Question
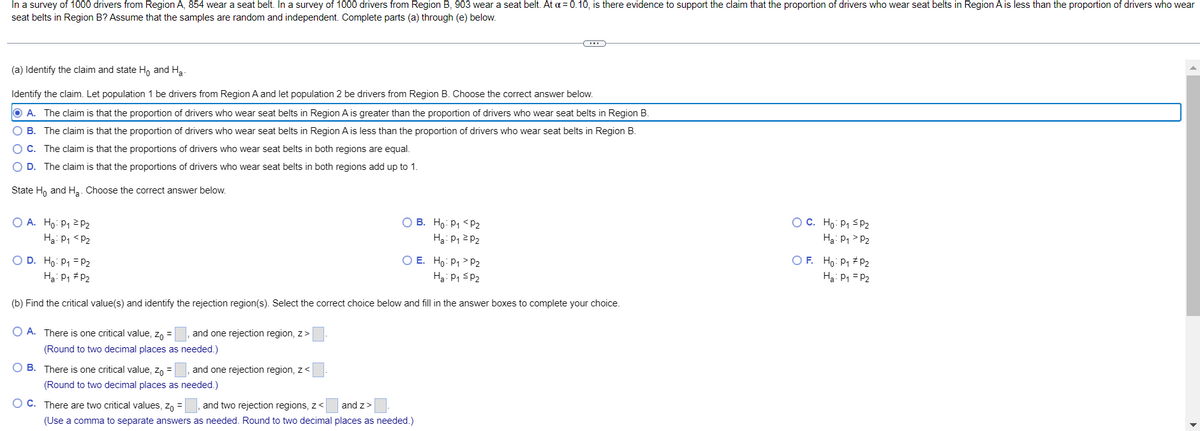

Transcribed Image Text:In a survey of 1000 drivers from Region A, 854 wear a seat belt. In a survey of 1000 drivers from Region B, 903 wear a seat belt. At a = 0.10, is there evidence to support the claim that the proportion of drivers who wear seat belts in Region A is less than the proportion of drivers who wear
seat belts in Region B? Assume that the samples are random and independent. Complete parts (a) through (e) below.
(a) Identify the claim and state Ho and Ha
Identify the claim. Let population 1 be drivers from Region A and let population 2 be drivers from Region B. Choose the correct answer below.
O A. The claim is that the proportion of drivers who wear seat belts in Region A is greater than the proportion of drivers who wear seat belts in Region B.
O B. The claim is that the proportion of drivers who wear seat belts in Region A is less than the proportion of drivers who wear seat belts in Region B.
OC. The claim is that the proportions of drivers who wear seat belts in both regions are equal.
O D. The claim is that the proportions of drivers who wear seat belts in both regions add up to 1.
State H, and Ha. Choose the correct answer below.
O A. Ho: P1 2 P2
O B. Ho: P1 <p2
Ha: P1 2 P2
OC. Ho: P1 sP2
Hạ: P1 <P2
H3: P1 > P2
O E. Ho: P1 > P2
Ha: P1 SP2
O F. Ho: P1 # P2
O D. Ho: P1 = P2
Ha: P1 # P2
Hạ: P1 = P2
(b) Find the critical value(s) and identify the rejection region(s). Select the correct choice below and fill in the answer boxes to complete your choice.
O A. There is one critical value, zo =
and one rejection region, z>
(Round to two decimal places as needed.)
O B. There is one critical value, zn =
and one rejection region, z<
(Round to two decimal places as needed.)
O C. There are two critical values, z, =
and two rejection regions, z<
and z>
(Use a comma to separate answers as needed. Round to two decimal places as needed.)

Transcribed Image Text:(c) Find the standardized test statistic, z.
z=
(Round to two decimal places as needed.)
(d) Decide whether to reject or fail to reject the null hypothesis.
Since z
in the rejection region(s),
Ho-
(e) Interpret the decision in the context of the original claim.
There
enough evidence at the a= 0.10 level of significance to support the claim that the proportion of drivers who wear seat belts in Region A is
the proportion of drivers who wear seat belts in Region B.
Expert Solution
This question has been solved!
Explore an expertly crafted, step-by-step solution for a thorough understanding of key concepts.

This is a popular solution

Trending nowThis is a popular solution!

Step by stepSolved in 3 steps with 3 images

Knowledge Booster

Similar questions
- The U.S. Energy Information Administration claimed that U.S. residential customers used an average of 10,941 kilowatt hours (kWh) of electricity this year. A local power company believes that residents in their area use more electricity on average than EIA's reported average. To test their claim, the company chooses a random sample of 115 of their customers and calculates that these customers used an average of 11,425 kWh of electricity last year. Assuming that the population standard deviation is 3217 kWh, is there sufficient evidence to support the power company's claim at the 0.02 level of significance? Step 3 of 3: Draw a conclusion and interpret the decision.arrow_forwardThe U.S. Energy Information Administration claimed that U.S. residential customers used an average of 10,069 kilowatt hours (kWh) of electricity this year. A local power company believes that residents in their area use more electricity on average than EIA's reported average. To test their claim, the company chooses a random sample of 171 of their customers and calculates that these customers used an average of 10,461 kWh of electricity last year. Assuming that the population standard deviation is 2973 kWh, is there sufficient evidence to support the power company's claim at the 0.01 level of significance? Step 2 of 3: Compute the value of the test statistic. Round your answer to two decimal places.arrow_forwardIn a survey of 180 females who recently completed high school, 75% were enrolled in college. In a survey of 160 males who recently completed high school,70 % were enrolled in college. At a=.009, can you reject the claim that there is no difference in the proportion of college enrollees between the two groups? Assume the random samples are independent. Complete parts (a) through (e).arrow_forward
- In a survey of 250 males ages 20 to 24, 37% were neither in school nor working. In a survey of 240 females ages 20 to 24, 44% were neither in school nor working. These samples are random and independent. At a = 0.09, can you support the claim that the proportion of males ages 20 to 24 who were neither in school nor working is less than the proportion of females ages 20 to 24 who were neither in school nor working? Complete parts (a) through (e) below. (d) Decide whether to reject or fail to reject the null hypothesis. Choose the correct answer below. O Reject Ho. O Fail to reject Hg- (e) Interpret the decision in the context of the original claim. Choose the correct answer below. O A. At the 9% significance level, there is sufficient evidence to reject the claim. O B. At the 9% significance level, there is insufficient evidence to support the claim. OC. At the 9% significance level, there is insufficient evidence to reject the claim. O D. At the 9% significance level, there is…arrow_forwardA simple random sample of front-seat occupants involved in car crashes is obtained. Among3000occupants not wearing seat belts,36were killed. Among 7697occupants wearing seat belts,18were killed. Use a0.05significance level to test the claim that seat belts are effective in reducing fatalities. Complete parts (a) through (c) below.arrow_forwardA random sample of 160 car accidents are selected and categorized by the age of the driver determined to be at fault. The results are listed below. The age distribution of drivers for the given categories is 18% for the under 26 group, 39% for the 26-45 group, 31% for the 45-65 group, and 12% for the group over 65. Find the rejection region used to test the claim that all ages have crash rates proportional to their number of drivers.arrow_forward
- Random sample of team members average practice time. Team A: x-bar=52.3, s=9.7, n=125 Team B: x-bar=45.6, s=13.3, n=120 a) Does the data provide convincing statistical evidence that team B spends less time practicing, on average, than those on Team A? b) What type of error, Type I or Typy II, could have been made and the consequences?arrow_forwardI need help on my classworkarrow_forwardDr. Maddan's eye drops are supposed to cause significant reduction is eye redness. The following table shows the results of a recent study where a random sample of individuals took part in a placebo controlled study. No Reduction in Redness Reduction in Redness Total Eye Drops 120 220 340 No Eye Drops Total 120 140 260 240 360 600 With 5% level of significance, determine if eye redness reduction is dependent upon taking the eye drops. Provide, a. the Chi-square statistic. b. the critical value or the p-value. c. Your decision on whether or not to reject Ho.arrow_forward
- The news release referenced in the previous exercise also included data fromindependent samples of teenage drivers and parents of teenage drivers. In response to aquestion asking if they approved of laws banning the use of cell phones and texting whiledriving, 74% of the teens surveyed and 95% of the parents surveyed said they approved.The sample sizes were not given in the news release, but suppose that 600 teens and 400 parents of teens were surveyed and that these samples are representative of the twopopulations. Do the data provide convincing evidence that the proportion of teens whoapprove of banning cell phone and texting while driving is less than the proportion ofparents of teens who approve?arrow_forwardThe U.S. Energy Information Administration claimed that U.S. residential customers used an average of 10,817 kilowatt hours (kWh) of electricity this year. A local power company believes that residents in their area use more electricity on average than EIA's reported average. To test their claim, the company chooses a random sample of 174 of their customers and calculates that these customers used an average of 11,156kWh of electricity last year. Assuming that the population standard deviation is 1913kWh, is there sufficient evidence to support the power company's claim at the 0.05 level of significance. Step 1 of 3 : State the null and alternative hypotheses for the test. Choose one option below H0: μ=10,817 HA: μ⎯⎯⎯⎯⎯⎯⎯⎯⎯⎯⎯⎯⎯⎯⎯10,817 A.≠ B.< C.> Step 2 of 3 : Compute the value of the test statistic. Round your answer to two decimal places.arrow_forward
arrow_back_ios
arrow_forward_ios
Recommended textbooks for you
- MATLAB: An Introduction with ApplicationsStatisticsISBN:9781119256830Author:Amos GilatPublisher:John Wiley & Sons Inc
 Probability and Statistics for Engineering and th...StatisticsISBN:9781305251809Author:Jay L. DevorePublisher:Cengage Learning
 Statistics for The Behavioral Sciences (MindTap C...StatisticsISBN:9781305504912Author:Frederick J Gravetter, Larry B. WallnauPublisher:Cengage Learning
  Elementary Statistics: Picturing the World (7th E...StatisticsISBN:9780134683416Author:Ron Larson, Betsy FarberPublisher:PEARSON
 The Basic Practice of StatisticsStatisticsISBN:9781319042578Author:David S. Moore, William I. Notz, Michael A. FlignerPublisher:W. H. Freeman
 Introduction to the Practice of StatisticsStatisticsISBN:9781319013387Author:David S. Moore, George P. McCabe, Bruce A. CraigPublisher:W. H. Freeman
MATLAB: An Introduction with Applications
Statistics
ISBN:9781119256830
Author:Amos Gilat
Publisher:John Wiley & Sons Inc
Probability and Statistics for Engineering and th...
Statistics
ISBN:9781305251809
Author:Jay L. Devore
Publisher:Cengage Learning
Statistics for The Behavioral Sciences (MindTap C...
Statistics
ISBN:9781305504912
Author:Frederick J Gravetter, Larry B. Wallnau
Publisher:Cengage Learning
Elementary Statistics: Picturing the World (7th E...
Statistics
ISBN:9780134683416
Author:Ron Larson, Betsy Farber
Publisher:PEARSON
The Basic Practice of Statistics
Statistics
ISBN:9781319042578
Author:David S. Moore, William I. Notz, Michael A. Fligner
Publisher:W. H. Freeman
Introduction to the Practice of Statistics
Statistics
ISBN:9781319013387
Author:David S. Moore, George P. McCabe, Bruce A. Craig
Publisher:W. H. Freeman