
MATLAB: An Introduction with Applications
6th Edition
ISBN: 9781119256830
Author: Amos Gilat
Publisher: John Wiley & Sons Inc
expand_more
expand_more
format_list_bulleted
Related questions
Topic Video
Question
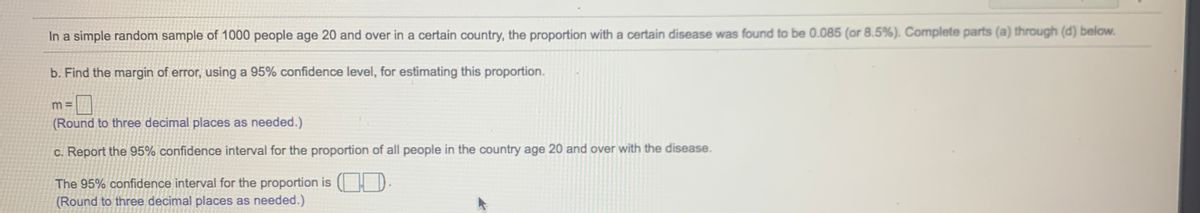

Transcribed Image Text:In a simple random sample of 1000 people age 20 and over in a certain country, the proportion with a certain disease was found to be 0.085 (or 8.5%). Complete parts (a) through (d) below.
b. Find the margin of error, using a 95% confidence level, for estimating this proportion.
(Round to three decimal places as needed.)
c. Report the 95% confidence interval for the proportion of all people in the country age 20 and over with the disease.
The 95% confidence interval for the proportion is ( D.
(Round to three decimal places as needed.)
Expert Solution
This question has been solved!
Explore an expertly crafted, step-by-step solution for a thorough understanding of key concepts.

This is a popular solution

Trending nowThis is a popular solution!

Step by stepSolved in 3 steps

Knowledge Booster


Learn more about
Need a deep-dive on the concept behind this application? Look no further. Learn more about this topic, statistics and related others by exploring similar questions and additional content below.Similar questions
- In a study of government financial aid for college students, it becomes necessary to estimate the percentage of full-time college students who earn a bachelor's degree in four years or less. Find the sample size needed to estimate that percentage. Use a 0.04 margin of error and use a confidence level of 95%.Complete parts (a) through (c) below. a. Assume that nothing is known about the percentage to be estimated. n=? (Round up to the nearest integer.) b. Assume prior studies have shown that about 60% of full-time students earn bachelor's degrees in four years or less. n=? (Round up to the nearest integer.) c. Does the added knowledge in part (b) have much of an effect on the sample size? A. No, using the additional survey information from part (b) does not change the sample size. B. Yes, using the additional survey information from part (b) dramatically reduces the sample size. C. No, using the additional survey information from…arrow_forward(Please explain what I was doing wrong)arrow_forwardA doctor wants to estimate the mean HDL cholesterol of all 20- to 29-year-old females. How many subjects are needed to estimate the mean HDL cholesterol within 3 points with 99% confidence assuming s=17.8 based on earlier studies? Suppose the doctor would be content with 99% confidence. How does the decrease in confidence affect the sample size required? a. A 99% confidence level requires _______ subject. b. 90% confidence level requires ________ subject. c.How does the decrease in confidence affect the sample size required? a.Decreasing the confidence level decreases the sample size needed. b.Decreasing the confidence level increases the sample size needed. c.The sample size is the same for all levels of confidence.arrow_forward
- Here are summary statistics for randomly selected weights of newborn girls: n = 36, x=3211.1 g, s= 689.4 g. Use a confidence level of 90% to complete parts (a) through (d) below.arrow_forwardTina catches a 14-pound bass. She does not know the population mean or standard deviation. So she takes a sample of five friends and they say the last bass they caught was 9, 12, 13, 10, and 10 pounds. Find the t and calculate a 95% (α = .05) confidence interval.arrow_forwardA researcher would like to know how much physical endurance is affected by a common herbal supplement. The researcher measures endurance for a sample of n = 9 participants. Each is then given a 30-day supply of the herbs and, one month later, endurance is measured again. For this sample, endurance increased by an average of MD= 6 points with SSD = 216. a. make a point estimate of the mean difference in endurance after taking the herbs. b. make a 95% confidence interval estimate of the population mean difference.arrow_forward
- 1. The heights ( in inches) of the students on a campus are assumed to have a normal distribution with a standard deviation of 4 inches. A random sample of 49 students was taken with M=68 inches. The 95% confidence interval for the population mean is:arrow_forwardIn a clinical trial of a certain drug, 17 subjects experience headaches among the 222 subjects treated with the drug. Construct a 90% (Wald) confidence interval estimate for the proportion of treated subjects who experience headaches, completing parts (a) through (d) below. a. Find the best point estimate of the population proportion. (Type an integer or a decimal rounded to three decimal places b. Identify the value of the margin of error E. needed.) Type an integer or a decimal rounded to three decimal places as needed.) c. Construct the confidence interval. 0arrow_forwardI only need part Barrow_forward
arrow_back_ios
arrow_forward_ios
Recommended textbooks for you
- MATLAB: An Introduction with ApplicationsStatisticsISBN:9781119256830Author:Amos GilatPublisher:John Wiley & Sons Inc
 Probability and Statistics for Engineering and th...StatisticsISBN:9781305251809Author:Jay L. DevorePublisher:Cengage Learning
 Statistics for The Behavioral Sciences (MindTap C...StatisticsISBN:9781305504912Author:Frederick J Gravetter, Larry B. WallnauPublisher:Cengage Learning
  Elementary Statistics: Picturing the World (7th E...StatisticsISBN:9780134683416Author:Ron Larson, Betsy FarberPublisher:PEARSON
 The Basic Practice of StatisticsStatisticsISBN:9781319042578Author:David S. Moore, William I. Notz, Michael A. FlignerPublisher:W. H. Freeman
 Introduction to the Practice of StatisticsStatisticsISBN:9781319013387Author:David S. Moore, George P. McCabe, Bruce A. CraigPublisher:W. H. Freeman
MATLAB: An Introduction with Applications
Statistics
ISBN:9781119256830
Author:Amos Gilat
Publisher:John Wiley & Sons Inc
Probability and Statistics for Engineering and th...
Statistics
ISBN:9781305251809
Author:Jay L. Devore
Publisher:Cengage Learning
Statistics for The Behavioral Sciences (MindTap C...
Statistics
ISBN:9781305504912
Author:Frederick J Gravetter, Larry B. Wallnau
Publisher:Cengage Learning
Elementary Statistics: Picturing the World (7th E...
Statistics
ISBN:9780134683416
Author:Ron Larson, Betsy Farber
Publisher:PEARSON
The Basic Practice of Statistics
Statistics
ISBN:9781319042578
Author:David S. Moore, William I. Notz, Michael A. Fligner
Publisher:W. H. Freeman
Introduction to the Practice of Statistics
Statistics
ISBN:9781319013387
Author:David S. Moore, George P. McCabe, Bruce A. Craig
Publisher:W. H. Freeman