MATLAB: An Introduction with Applications
6th Edition
ISBN: 9781119256830
Author: Amos Gilat
Publisher: John Wiley & Sons Inc
expand_more
expand_more
format_list_bulleted
Question
(Please explain what I was doing wrong)

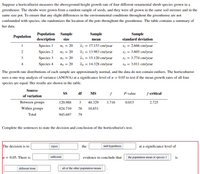
Transcribed Image Text:Suppose a horticulturist measures the aboveground height growth rate of four different ornamental shrub species grown in a
greenhouse. The shrubs were grown from a random sample of seeds, and they were all grown in the same soil mixture and in the
same size pot. To ensure that any slight differences in the environmental conditions throughout the greenhouse are not
confounded with species, she randomizes the location of the pots throughout the greenhouse. The table contains a summary of
her data.
Population Sample
description
Sample
Sample
Population
size
mean
standard deviation
1
Species 1
ni = 20
17.153 cm/year
SI =
2.666 cm/year
s2 = 3.605 cm/year
S3 = 3.774 cm/year
2
Species 2
n2 = 20
X2 — 13.983 сm/year
3
Species 3
n3 = 20
x3 = 15.120 cm/year
4
Species 4
n4 = 20
X4 =
14.328 cm/year
S4 = 3.011 cm/year
The growth rate distributions of each sample are approximately normal, and the data do not contain outliers. The horticulturist
uses a one-way analysis of variance (ANOVA) at a significance level of a = 0.05 to test if the mean growth rates of all four
species are equal. Her results are shown in the table.
Source
SS
df
MS
f
P-value
f-critical
of variation
Between groups
120.988
3
40.329
3.716
0.015
2.725
Within groups
824.710
76
10.851
Total
945.697
79
Complete the sentences to state the decision and conclusion of the horticulturist's test.
The decision is to
reject
the
null hypothesis
at a significance level of
a = 0.05. There is
is
sufficient
evidence to conclude that
the population mean of species 1
different from
all of the other population means
Expert Solution
This question has been solved!
Explore an expertly crafted, step-by-step solution for a thorough understanding of key concepts.
This is a popular solution
Trending nowThis is a popular solution!
Step by stepSolved in 2 steps

Knowledge Booster
Similar questions
- Mr. Imperfecto teaches another math class. This time he has 23 students take a test, the average score on which is an 87. Mr. Imperfecto realizes he put the wrong grade in for a student. He entered a 35, and the score should have been an 85. To the nearest integer, what is the new class average?arrow_forwardA and B marked as incorrectarrow_forward
arrow_back_ios
arrow_forward_ios
Recommended textbooks for you
 MATLAB: An Introduction with ApplicationsStatisticsISBN:9781119256830Author:Amos GilatPublisher:John Wiley & Sons Inc
 Probability and Statistics for Engineering and th...StatisticsISBN:9781305251809Author:Jay L. DevorePublisher:Cengage Learning
 Statistics for The Behavioral Sciences (MindTap C...StatisticsISBN:9781305504912Author:Frederick J Gravetter, Larry B. WallnauPublisher:Cengage Learning
 Elementary Statistics: Picturing the World (7th E...StatisticsISBN:9780134683416Author:Ron Larson, Betsy FarberPublisher:PEARSON
 The Basic Practice of StatisticsStatisticsISBN:9781319042578Author:David S. Moore, William I. Notz, Michael A. FlignerPublisher:W. H. Freeman
 Introduction to the Practice of StatisticsStatisticsISBN:9781319013387Author:David S. Moore, George P. McCabe, Bruce A. CraigPublisher:W. H. Freeman

MATLAB: An Introduction with Applications
Statistics
ISBN:9781119256830
Author:Amos Gilat
Publisher:John Wiley & Sons Inc

Probability and Statistics for Engineering and th...
Statistics
ISBN:9781305251809
Author:Jay L. Devore
Publisher:Cengage Learning

Statistics for The Behavioral Sciences (MindTap C...
Statistics
ISBN:9781305504912
Author:Frederick J Gravetter, Larry B. Wallnau
Publisher:Cengage Learning

Elementary Statistics: Picturing the World (7th E...
Statistics
ISBN:9780134683416
Author:Ron Larson, Betsy Farber
Publisher:PEARSON

The Basic Practice of Statistics
Statistics
ISBN:9781319042578
Author:David S. Moore, William I. Notz, Michael A. Fligner
Publisher:W. H. Freeman

Introduction to the Practice of Statistics
Statistics
ISBN:9781319013387
Author:David S. Moore, George P. McCabe, Bruce A. Craig
Publisher:W. H. Freeman