MATLAB: An Introduction with Applications
6th Edition
ISBN: 9781119256830
Author: Amos Gilat
Publisher: John Wiley & Sons Inc
expand_more
expand_more
format_list_bulleted
Question

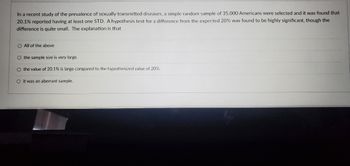
Transcribed Image Text:In a recent study of the prevalence of sexually transmitted diseases, a simple random sample of 35,000 Americans were selected and it was found that
20.1% reported having at least one STD. A hypothesis test for a difference from the expected 20% was found to be highly significant, though the
difference is quite small. The explanation is that
O All of the above
O the sample size is very large.
O the value of 20.1% is large compared to the hypothesized value of 20%.
O it was an aberrant sample.
Expert Solution
This question has been solved!
Explore an expertly crafted, step-by-step solution for a thorough understanding of key concepts.
This is a popular solution
Trending nowThis is a popular solution!
Step by stepSolved in 2 steps

Knowledge Booster
Similar questions
- A study was carried out to evaluate the safety of motorcycle helmets. 40 randomly selected helmets were subiected to a certain impact test and 20 were found to show no damage. The study claimed that the proportion of all helmets that would show no damage when tested in the prescribed manner is smaller than 62.5% (i.e. 5/8). With what confidence can this be claimed? a. 0.91 b. 0.93 c.0.95arrow_forwardQuestion #4arrow_forwarda particular hypothesis test is left-tailed, and the area to the left of the test statistic is 0.20. what is the p-value?arrow_forward
- A news article that you read stated that 52% of voters prefer the Democratic candidate. You think that the actual percent is larger. 149 of the 266 voters that you surveyed said that they prefer the Democratic candidate. What can be concluded at the 0.05 level of significance? For this study, we should use Select an answer t-test for a population mean z-test for a population proportion The null and alternative hypotheses would be: Ho: ? p μ Select an answer ≤ = < ≥ ≠ > (please enter a decimal) H1: ? p μ Select an answer > ≥ ≤ = < ≠ (Please enter a decimal) The test statistic ? z t = (please show your answer to 3 decimal places.)arrow_forwardSuppose a 95% confidence interval for the difference in test scores between Class 1 and Class 2 (in that order) is the following: 9 +/− 2. These results were based on independent samples of size 100 from each class. Now suppose you switch the order of Class 1 and Class 2 in your analysis but keep the data labeled correctly in terms of which class they came from. Which of the following statements is false? A) You can't do it this way. You'll get negative numbers for the difference in the means and/or negative numbers for the standard error. B) You are confident that the average for Class 2 is 7 to 11 points lower than for Class 1. C) You are still confident that the classes have significantly different mean scores. D) Your 95% confidence interval will now be entirely negative: from −7 to −11.arrow_forwardA preliminary study regarding the number of AIDS cases reported for Santa Clara County, California is broken down by race in the table below. White Hispanic Black Asian/Pacific Islander TOTAL Race White Hispanic Black Conduct a chi-square test for goodness-of-fit to determine whether or not the occurrence of AIDS cases is consistent with the race distribution of Santa Clara County. Cases Choose the correct null and alternative hypotheses: O Ho: The distribution of AIDS cases is different from the race distribution in Santa Clara County. Ha: The distribution of AIDS cases is consistent with the race distribution in Santa Clara County. TOTAL 22 Ho: The distribution of AIDS cases is consistent with the race distribution in Santa Clara County. Ha : The distribution of AIDS cases is different from the race distribution in Santa Clara County. Race Asian/Pacific Islander 14 ▼ Part 2 of 4 The population distribution of Santa Clara County by race is provided in the table below. Use these…arrow_forward
arrow_back_ios
arrow_forward_ios
Recommended textbooks for you
 MATLAB: An Introduction with ApplicationsStatisticsISBN:9781119256830Author:Amos GilatPublisher:John Wiley & Sons Inc
 Probability and Statistics for Engineering and th...StatisticsISBN:9781305251809Author:Jay L. DevorePublisher:Cengage Learning
 Statistics for The Behavioral Sciences (MindTap C...StatisticsISBN:9781305504912Author:Frederick J Gravetter, Larry B. WallnauPublisher:Cengage Learning
 Elementary Statistics: Picturing the World (7th E...StatisticsISBN:9780134683416Author:Ron Larson, Betsy FarberPublisher:PEARSON
 The Basic Practice of StatisticsStatisticsISBN:9781319042578Author:David S. Moore, William I. Notz, Michael A. FlignerPublisher:W. H. Freeman
 Introduction to the Practice of StatisticsStatisticsISBN:9781319013387Author:David S. Moore, George P. McCabe, Bruce A. CraigPublisher:W. H. Freeman

MATLAB: An Introduction with Applications
Statistics
ISBN:9781119256830
Author:Amos Gilat
Publisher:John Wiley & Sons Inc

Probability and Statistics for Engineering and th...
Statistics
ISBN:9781305251809
Author:Jay L. Devore
Publisher:Cengage Learning

Statistics for The Behavioral Sciences (MindTap C...
Statistics
ISBN:9781305504912
Author:Frederick J Gravetter, Larry B. Wallnau
Publisher:Cengage Learning

Elementary Statistics: Picturing the World (7th E...
Statistics
ISBN:9780134683416
Author:Ron Larson, Betsy Farber
Publisher:PEARSON

The Basic Practice of Statistics
Statistics
ISBN:9781319042578
Author:David S. Moore, William I. Notz, Michael A. Fligner
Publisher:W. H. Freeman

Introduction to the Practice of Statistics
Statistics
ISBN:9781319013387
Author:David S. Moore, George P. McCabe, Bruce A. Craig
Publisher:W. H. Freeman