
MATLAB: An Introduction with Applications
6th Edition
ISBN: 9781119256830
Author: Amos Gilat
Publisher: John Wiley & Sons Inc
expand_more
expand_more
format_list_bulleted
Related questions
Question
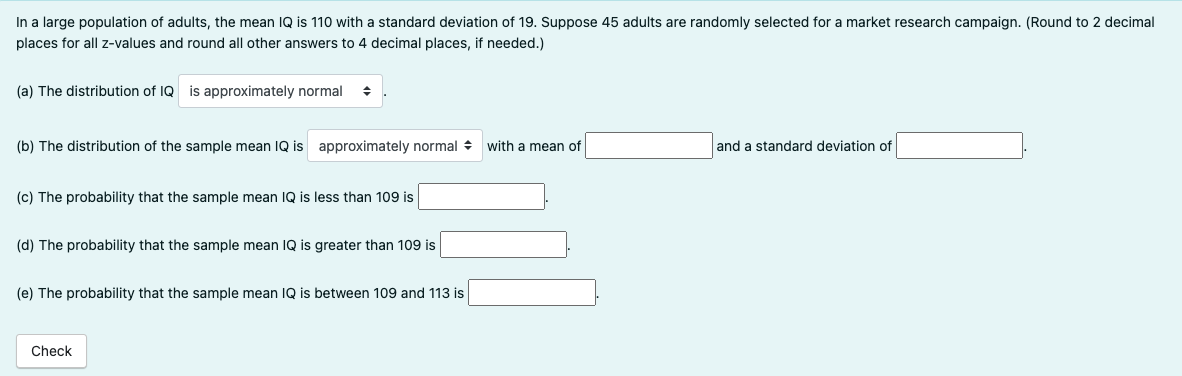

Transcribed Image Text:In a large population of adults, the mean IQ is 110 with a standard deviation of 19. Suppose 45 adults are randomly selected for a market research campaign. (Round to 2 decimal
places for all z-values and round all other answers to 4 decimal places, if needed.)
(a) The distribution of IQ is approximately normal →
(b) The distribution of the sample mean IQ is approximately normal
(c) The probability that the sample mean IQ is less than 109 is
(d) The probability that the sample mean IQ is greater than 109 is
(e) The probability that the sample mean IQ is between 109 and 113 is
Check
with a mean of
and a standard deviation of
Expert Solution
This question has been solved!
Explore an expertly crafted, step-by-step solution for a thorough understanding of key concepts.

Step by stepSolved in 4 steps with 1 images

Knowledge Booster

Similar questions
- A standardized exam's scores are normally distributed. In a recent year, the mean test score was 1471 and the standard deviation was 318. The test scores of four students selected at random are 1910, 1210, 2210, and 1370. Find the z-scores that correspond to each value and determine whether any of the values are unusual. The z-score for 1910 is (Round to two decimal places as needed.)arrow_forwardA person's blood glucose level and diabetes are closely related. Let x be a random variable measured in milligrams of glucose per deciliter (1/10 of a liter) of blood. Suppose that after a 12-hour fast, the random variable x will have a distribution that is approximately normal with mean ? = 82 and standard deviation ? = 22. Note: After 50 years of age, both the mean and standard deviation tend to increase. For an adult (under 50) after a 12-hour fast, find the following probabilities. (Round your answers to four decimal places.) (a) x is more than 60(b) x is less than 110(c) x is between 60 and 110(d) x is greater than 125 (borderline diabetes starts at 125)arrow_forwardA person's blood glucose level and diabetes are closely related. Let x be a random variable measured in milligrams of glucose per deciliter (1/10 of a liter) of blood. Suppose that after a 12-hour fast, the random variable x will have a distribution that is approximately normal with mean ? = 81 and standard deviation ? = 26. Note: After 50 years of age, both the mean and standard deviation tend to increase. For an adult (under 50) after a 12-hour fast, find the following probabilities. (Round your answers to four decimal places.) (a) x is more than 60(b) x is less than 110(c) x is between 60 and 110(d) x is greater than 125 (borderline diabetes starts at 125)arrow_forward
- A person's blood glucose level and diabetes are closely related. Let x be a random variable measured in milligrams of glucose per deciliter (1/10 of a liter) of blood. Suppose that after a 12-hour fast, the random variable x will have a distribution that is approximately normal with mean ? = 87 and standard deviation ? = 22. Note: After 50 years of age, both the mean and standard deviation tend to increase. For an adult (under 50) after a 12-hour fast, find the following probabilities. (Round your answers to four decimal places.) (c) x is between 60 and 110 (d) x is greater than 125 (borderline diabetes starts at 125)arrow_forwardThe mean of the test is 89 with a standard deviation of only 4. How likely (what probability) is there that a student scored a perfect score of 100 or better?arrow_forward
arrow_back_ios
arrow_forward_ios
Recommended textbooks for you
- MATLAB: An Introduction with ApplicationsStatisticsISBN:9781119256830Author:Amos GilatPublisher:John Wiley & Sons Inc
 Probability and Statistics for Engineering and th...StatisticsISBN:9781305251809Author:Jay L. DevorePublisher:Cengage Learning
 Statistics for The Behavioral Sciences (MindTap C...StatisticsISBN:9781305504912Author:Frederick J Gravetter, Larry B. WallnauPublisher:Cengage Learning
  Elementary Statistics: Picturing the World (7th E...StatisticsISBN:9780134683416Author:Ron Larson, Betsy FarberPublisher:PEARSON
 The Basic Practice of StatisticsStatisticsISBN:9781319042578Author:David S. Moore, William I. Notz, Michael A. FlignerPublisher:W. H. Freeman
 Introduction to the Practice of StatisticsStatisticsISBN:9781319013387Author:David S. Moore, George P. McCabe, Bruce A. CraigPublisher:W. H. Freeman
MATLAB: An Introduction with Applications
Statistics
ISBN:9781119256830
Author:Amos Gilat
Publisher:John Wiley & Sons Inc
Probability and Statistics for Engineering and th...
Statistics
ISBN:9781305251809
Author:Jay L. Devore
Publisher:Cengage Learning
Statistics for The Behavioral Sciences (MindTap C...
Statistics
ISBN:9781305504912
Author:Frederick J Gravetter, Larry B. Wallnau
Publisher:Cengage Learning
Elementary Statistics: Picturing the World (7th E...
Statistics
ISBN:9780134683416
Author:Ron Larson, Betsy Farber
Publisher:PEARSON
The Basic Practice of Statistics
Statistics
ISBN:9781319042578
Author:David S. Moore, William I. Notz, Michael A. Fligner
Publisher:W. H. Freeman
Introduction to the Practice of Statistics
Statistics
ISBN:9781319013387
Author:David S. Moore, George P. McCabe, Bruce A. Craig
Publisher:W. H. Freeman