ENGR.ECONOMIC ANALYSIS
14th Edition
ISBN: 9780190931919
Author: NEWNAN
Publisher: Oxford University Press
expand_more
expand_more
format_list_bulleted
Question
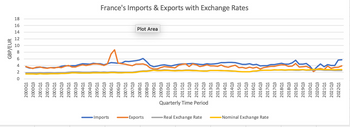
What does this graph show?

Transcribed Image Text:-Imports
-Exports
-Real Exchange Rate
-Nominal Exchange Rate
Quarterly Time Period
2000Q1
2000Q3
2001Q1
2001 Q3
2002Q1
2002 Q3
2003Q1
2003 Q3
2004Q1
2004 Q3
2005Q1
2005 Q3
2006Q1
2006Q3
2007Q1
2007Q3
2008Q1
2008Q3
2009Q1
2009Q3
2010Q1
2010Q3
2011Q1
2011Q3
2012Q1
2012Q3
2013Q1
2013Q3
2014Q1
2014Q3
2015Q1
2015Q3
2016Q1
2016Q3
2017Q1
2017Q3
2018Q1
2018Q3
2019Q1
2019Q3
2020Q1
2020Q3
2021Q1
2021Q3
2022Q1
GBP/EUR
ONA 900
12
14
16
18
Plot Area
France's Imports & Exports with Exchange Rates
Expert Solution
This question has been solved!
Explore an expertly crafted, step-by-step solution for a thorough understanding of key concepts.
Step by stepSolved in 3 steps

Knowledge Booster
Learn more about
Need a deep-dive on the concept behind this application? Look no further. Learn more about this topic, economics and related others by exploring similar questions and additional content below.Similar questions
- Results Real Estate had 6 home sales during the week: $150,000, $140,000, $240,000, $158,000, $3,200,000, and $150,000. What is the mode?arrow_forwardCompany X is going to buy a total of 4 ads. They are going to advertise in the newspaper or on the radio. The more ads they buy the more customers they have based on the following schedule. Number of Ads Total new customers from newspaper ads Total new customers from radio ads 0 0 0 1 100 200 2 180 320 3 220 390 4 240 400 In this case, the best strategy is to buy newspaper ads and radio ads. Enter whole numbers.arrow_forwardThe ratio of Consumption to savings is given as 5/3 Calculate the value of savings if the value of income is $6000arrow_forward
- Total Total Total Product Fixed Variable (Blankets) Cost Cost 0 A 0 1 60 25 2 60 40 3 60 I 4 60 55 5 60 55 6 60 70 7 60 100 8 60 145 A What is the numerical value of B? A/ What is the numerical value of C? A/ Total Cost What is the numerical value of D? B 85 100 110 G 115 130 160 205 Average Average Average Variable Total Fixed Cost Cost cost - с 60 30 20 15 12 8.6 7.5 25 20 16.7 13.8 Ꭰ 11.7 14.3 18.1 E The table describes the short-run daily costs of the Baby Blanket Company. What is the numerical value of A? 85 36.7 28.8 J 21.7 22.9 25.6 Marginal Cost F H 15 10 0 15 30 45arrow_forwardThe accompanying graph is an example of 70000 60000 50000 20000 10000 .. Firate's crime rate cross-sectional data. experimental data. a time series. longitudinal data. Rarrow_forwardquestion part c should contain a grapharrow_forward
arrow_back_ios
arrow_forward_ios
Recommended textbooks for you

 Principles of Economics (12th Edition)EconomicsISBN:9780134078779Author:Karl E. Case, Ray C. Fair, Sharon E. OsterPublisher:PEARSON
 Engineering Economy (17th Edition)EconomicsISBN:9780134870069Author:William G. Sullivan, Elin M. Wicks, C. Patrick KoellingPublisher:PEARSON
 Principles of Economics (MindTap Course List)EconomicsISBN:9781305585126Author:N. Gregory MankiwPublisher:Cengage Learning
 Managerial Economics: A Problem Solving ApproachEconomicsISBN:9781337106665Author:Luke M. Froeb, Brian T. McCann, Michael R. Ward, Mike ShorPublisher:Cengage Learning
 Managerial Economics & Business Strategy (Mcgraw-...EconomicsISBN:9781259290619Author:Michael Baye, Jeff PrincePublisher:McGraw-Hill Education


Principles of Economics (12th Edition)
Economics
ISBN:9780134078779
Author:Karl E. Case, Ray C. Fair, Sharon E. Oster
Publisher:PEARSON

Engineering Economy (17th Edition)
Economics
ISBN:9780134870069
Author:William G. Sullivan, Elin M. Wicks, C. Patrick Koelling
Publisher:PEARSON

Principles of Economics (MindTap Course List)
Economics
ISBN:9781305585126
Author:N. Gregory Mankiw
Publisher:Cengage Learning

Managerial Economics: A Problem Solving Approach
Economics
ISBN:9781337106665
Author:Luke M. Froeb, Brian T. McCann, Michael R. Ward, Mike Shor
Publisher:Cengage Learning

Managerial Economics & Business Strategy (Mcgraw-...
Economics
ISBN:9781259290619
Author:Michael Baye, Jeff Prince
Publisher:McGraw-Hill Education