Concept explainers
a) To begin your analysis, state your null hypothesis.
b) Perform a chi-square analysis. Make sure to analyze your traits to be consistent with the information provided. Clearly present your results in a table as shown in the attachement called Testing Genetics Ratios (Hint: should the traits be tested in males and females?)
c) State the correct # of degrees of freedom, calculate the chi-square value and show the approximate p value.
d) Make a statement of how the p value relates to whether you decided to reject or not reject, your null hypothesis.
e) Finally, make a concluding statement about your original genetic hypothesis(es) based on chi-square analysis.
Fully typed, organized correctly, correct spelling, and grammar.
Genetic hypothesis for each allele:
Trait: Leg length
- Hypothesis: The wild-type and mutant alleles for leg length are incomplete dominant relative to each other.
Trait: Wing shape
- Hypothesis: There are two alleles for wing type, one dominant and one recessive. Truncated wings allele is recessive, and the gene is X-linked.
Leg Length:
For the leg length trait, we see that the number of individuals with the medium leg
Additionally, there are no specific differences or ratios mentioned between males and females for leg length, indicating that the mode of inheritance is autosomal and specific to each allele. This supports the hypothesis of autosomal inheritance, with incomplete dominance between the alleles.
- The data set shows three phenotypic categories for leg length: wild type (long leg), medium leg, and truncated wings.
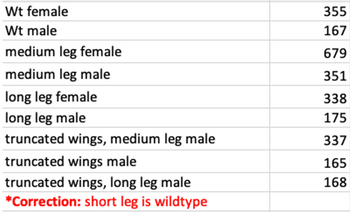
- The ratio of wild type females (355) to wild type males (167) suggests an autosomal inheritance pattern since both sexes show the wild type phenotype.
- The presence of medium leg females (679) and medium leg males (351) supports the hypothesis of incomplete dominance. The heterozygous individuals (F1) exhibit the intermediate phenotype.
- The absence of purebred short-legged individuals suggests the dominance of the long leg allele over the short leg allele.
Wing Shape:
The data set for wing shape: wild type (short leg) and truncated wings. Notably, the truncated wings phenotype is observed only in males, and there are no categories for truncated females. This absence of truncated females strongly suggests an X-linked inheritance pattern.
To further support this hypothesis, we can calculate the numbers provided in the data set. As mentioned in the example, by adding up the counts for truncated males (337 + 165 + 168), we obtain a total of 670 truncated individuals. However, since there are no categories or counts for truncated females, we can conclude that the number of truncated females is zero.
- The data set includes two phenotypic categories for wing shape: wild type (long leg) and truncated wings.
- The presence of truncated wings only in males indicates an X-linked inheritance pattern.
- The absence of truncated wings in females supports the hypothesis that the allele for truncated wings is recessive to the wild type allele.
- The presence of truncated wings in some males (e.g., truncated wings, medium leg male: 337) suggests that these males inherited the recessive allele from their mother (X-linked).
Explanation:
This discrepancy in the occurrence of the truncated wings phenotype between males and females provides strong evidence for an X-linked recessive inheritance pattern. Since males have only one X chromosome, the presence of a single truncated wing allele (X^T) is sufficient to manifest the phenotype, while females would require two copies of the allele.
Genetic symbols for the alleles:
Leg Length:
- Wild-type (short leg) allele: L+
- Medium leg allele: LM
- Long leg allele: LL
Wing Shape:
- Wild-type allele: W
- Truncated wing allele: w
Explanation:
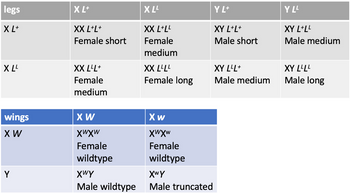
- The expected phenotypic ratio in the F2 generation for leg length will be 1:2:1, with 25% wildtype (short leg), 50% medium leg, and 25% long leg individuals.
- The expected phenotypic ratio in the F2 generation for wing shape will be 50% wildtype female, 25% wildtype male and 25% truncated male (only males will show this phenotype).
Ratios:
- Females
- Legs: (short/wildtype: medium: long) – 1: 2: 1
- Wings: (wildtype: truncated) – 2: 0
- Males
- Legs: (short/wildtype: medium: long) – 1: 2: 1
- Wings: (wildtype: truncated) – 1: 1


Trending nowThis is a popular solution!
Step by stepSolved in 3 steps

- One of the models for behavioral traits in humans involves a form of gene interaction known as epistasis. What is epistasis?arrow_forwardWhat is biological determinism? (Hint: are you destined to have the phenotype typically associated with your genotype? Do your genes determine your destiny?) Explain the misconception of biological determinism.arrow_forwardCystic fibrosis (CF) is an autosomal recessive trait. A three-generation pedigree is shown below for a family that carries the mutant allele for cystic fibrosis. Note that carriers are not colored in to allow you to figure out their genotypes. Normal allele = F CF mutant allele = f What is the genotype of individual #13? A) ff B) FF C) Ff D) it is impossible to tellarrow_forward
- A mouse genetics lab created a new mutant strain, and they noticed interesting behavioral and physiological differences in the mutant mice. Run two different databases: Running Duration and Body Mass and follow the interactive to graph the data. What best describes the physiology and behavior of the mutant mice? Check all that apply a) Overall, the mutant mice are heavier than the wildtype mice b) More than half the mutant mice were in the two lighter weight bins. c)The male wildtype mice ran more minutes than the mutant male mice. d) Both male and female mutant mice ran more minutes than wildtype mice. e) The mutants showed heavier weight and lower running activity.arrow_forwardIn assessing data that fell into two phenotypic classes, a geneticist observed values of 20:150. She decided to perform a Chi-Square (X) analysis by using the following two different null hypotheses: a) the data fit the 3:1 ratio, and b) the data fit the 1:1 ratio. Calculate the Chi-Square (x) values for each hypothesis. What can be concluded about each hypothesis?arrow_forwardFor the following five questions, A = true, and B = false 18. (2 pts) The dominance of an allele may vary for different traits. 19. (2 pts) Loss-of-function alleles are recessive, not dominant. 20. (2 pts) A haplosufficient allele is able to produce a wild-type phenotype in the heterozygous state. 21. (2 pts) The permissive temperature, which is usually lower than the normal growth temperature, is the temperature at which a mutant phenotype becomes observable. 22. (2 pts) In a cross between two true-breeding recessive mutants that are affected in different genes, the proportion of F1 progeny that show complementation (the wild-type phenotype) is affected by the map distance between the two genes.arrow_forward
- A complementation analysis was performed using pea plants which normally have purple flowers. Twenty-five mutants for white flower colour were discovered across 10 populations. The mutants were bred in a complementation test which showed two complementation groups with 10 mutants in one group and 15 in the other. (a) How many genes contribute to flower colour in pea plants based on this data? (b) Is it likely that more genes contribute to pea plant flower colour? Explainarrow_forwardGiven an observed F2 data set, a specified gene, and two phenotype classes (disease and wild type), the number of degrees of freedom for the chi-square goodness of fit test when studying the F2 generation is: A)-1. B)0. C)2. D)1. E)3.arrow_forwardAccording to Amar J. S. Klar, is there a such thing as “left handedness”? What is the preferred term? Describe how the genetics works, according to his hypothesis. What are the alleles, and which combinations of alleles make for which type of hand use?arrow_forward
- Sickle cell anemia is a genetic disease most common in those of African ancestry that results from the mutation of a single basepair. This mutation results in a change to the hemoglobin protein. In this experiment, “S” will represent the normal allele and “s” thesickle allele. They are codominant alleles. Therefore, SS is normal, Ss is not fatal but mildly symptomatic, and ss is debilitating,painful, and often fatal. After hundreds or even thousands of generations, both alleles are still common in those of African ancestry. How would you explain this?arrow_forwarda) what feature of the genome is likely to be located between the two LD blocks that allows scientists to visualize them as seperate blocks? b) Even though the fugure analyzes nine different SNPs, genotyping just two of se SNPs would allow you to predict the genotype of almost everyone in the population. Explain why this limited genotyping has predictive value. c) When obtaining the data allowing construction of triangular diagrams, have researchers typically genotyped common SNPs or rare SNPs? Explain.arrow_forward
 Human Anatomy & Physiology (11th Edition)BiologyISBN:9780134580999Author:Elaine N. Marieb, Katja N. HoehnPublisher:PEARSON
 Biology 2eBiologyISBN:9781947172517Author:Matthew Douglas, Jung Choi, Mary Ann ClarkPublisher:OpenStax
 Anatomy & PhysiologyBiologyISBN:9781259398629Author:McKinley, Michael P., O'loughlin, Valerie Dean, Bidle, Theresa StouterPublisher:Mcgraw Hill Education,
 Molecular Biology of the Cell (Sixth Edition)BiologyISBN:9780815344322Author:Bruce Alberts, Alexander D. Johnson, Julian Lewis, David Morgan, Martin Raff, Keith Roberts, Peter WalterPublisher:W. W. Norton & Company
 Laboratory Manual For Human Anatomy & PhysiologyBiologyISBN:9781260159363Author:Martin, Terry R., Prentice-craver, CynthiaPublisher:McGraw-Hill Publishing Co.
 Inquiry Into Life (16th Edition)BiologyISBN:9781260231700Author:Sylvia S. Mader, Michael WindelspechtPublisher:McGraw Hill Education


