
MATLAB: An Introduction with Applications
6th Edition
ISBN: 9781119256830
Author: Amos Gilat
Publisher: John Wiley & Sons Inc
expand_more
expand_more
format_list_bulleted
Related questions
Question
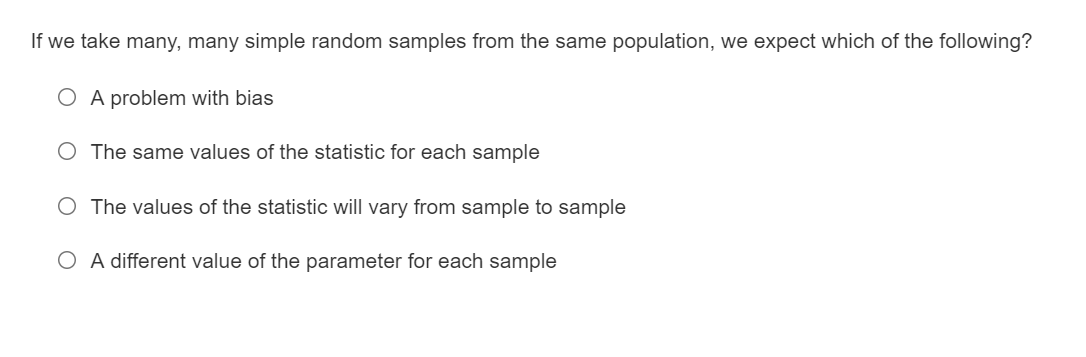

Transcribed Image Text:If we take many, many simple random samples from the same population, we expect which of the following?
O A problem with bias
O The same values of the statistic for each sample
O The values of the statistic will vary from sample to sample
O A different value of the parameter for each sample
Expert Solution
This question has been solved!
Explore an expertly crafted, step-by-step solution for a thorough understanding of key concepts.

This is a popular solution

Trending nowThis is a popular solution!

Step by stepSolved in 2 steps

Knowledge Booster

Similar questions
- First Sample Dota Set {32 37 44 49 53 ss3 use the first data se+ to find the Sample variance s. A. 81. 8 B. 82.8 C. 83.8 D. 84.8arrow_forwardThe Census Bureau gives this distribution for the number of people in American households in 2016. Family size 1 2 4 6. 7 Proportion 0.28 0.35 0.15 0.13 0.06 0.02 0.01 Note: In this table, 7 actually represents households of size 7 or greater. But for purposes of this exercise, assume that it means only households of size exactly 7. Suppose you take a random sample of 4000 American households. About how many of these households will be of size 2? Sizes 3 to 7? The number of households of size 2 is about The number of households of size 3 to 7 is aboutarrow_forwardWhich of the following are reasons that a sampling technique may not be scientific. Choose all that apply. The sample size is too small Self-Selected Sample The sample is not representative of the population The sample statistic is not exactly equal to the population parameter The wording of survey question influences the responsearrow_forward
- Help me with c and darrow_forwardSuppose you are testing four population means with independent samples. Further suppose the populations are normally distributed and the population variances are equal. Which overall test should you use? Group of answer choices The ANOVA F-test The Welch ANOVA test The Kruskal-Wallis test The Chi-Square Goodness of Fit testarrow_forwardThe data for recent year showed the taxes and million dollars received from a random sample 10 states find the first and third quarters in the IQ are 31 5 20 36 33 13 11 26 30 28arrow_forward
- Which of the following differentiates an experiment from an observational study? O Random selection of subjects Both random selection and random assignment Randomization of treatmentarrow_forwardA distribution of scores is positively skewed. Which is the most probable order, from smallest to largest, for the three measures of central tendency? O Mean, median, mode O Mode, median, mean Mean, mode, median O Median, mean, modearrow_forwardX 6.3.10 Question Help Three randomly selected households are surveyed. The numbers of people in the households are 2, 4, and 9. Assume that samples of sizen=2 are randomly selected with replacement from the population of 2, 4, and 9. Construct a probability distribution table that describes the sampling distribution of the proportion of odd numbers when samples of sizes n= 2 are randomly selected. Does the mean of the sample proportions equal the proportion of odd numbers in the population? Do the sample proportions target the value of the population proportion? Does the sample proportion make a good estimator of the population proportion? Listed below are the nine possible samples. 2,2 2,4 2,9 4,2 4,4 4,9 9,2 9,4 9,9 Construct the probability distribution table. Sample Probability Proportion (Type an integer or fraction.)arrow_forward
arrow_back_ios
arrow_forward_ios
Recommended textbooks for you
- MATLAB: An Introduction with ApplicationsStatisticsISBN:9781119256830Author:Amos GilatPublisher:John Wiley & Sons Inc
 Probability and Statistics for Engineering and th...StatisticsISBN:9781305251809Author:Jay L. DevorePublisher:Cengage Learning
 Statistics for The Behavioral Sciences (MindTap C...StatisticsISBN:9781305504912Author:Frederick J Gravetter, Larry B. WallnauPublisher:Cengage Learning
  Elementary Statistics: Picturing the World (7th E...StatisticsISBN:9780134683416Author:Ron Larson, Betsy FarberPublisher:PEARSON
 The Basic Practice of StatisticsStatisticsISBN:9781319042578Author:David S. Moore, William I. Notz, Michael A. FlignerPublisher:W. H. Freeman
 Introduction to the Practice of StatisticsStatisticsISBN:9781319013387Author:David S. Moore, George P. McCabe, Bruce A. CraigPublisher:W. H. Freeman
MATLAB: An Introduction with Applications
Statistics
ISBN:9781119256830
Author:Amos Gilat
Publisher:John Wiley & Sons Inc
Probability and Statistics for Engineering and th...
Statistics
ISBN:9781305251809
Author:Jay L. Devore
Publisher:Cengage Learning
Statistics for The Behavioral Sciences (MindTap C...
Statistics
ISBN:9781305504912
Author:Frederick J Gravetter, Larry B. Wallnau
Publisher:Cengage Learning
Elementary Statistics: Picturing the World (7th E...
Statistics
ISBN:9780134683416
Author:Ron Larson, Betsy Farber
Publisher:PEARSON
The Basic Practice of Statistics
Statistics
ISBN:9781319042578
Author:David S. Moore, William I. Notz, Michael A. Fligner
Publisher:W. H. Freeman
Introduction to the Practice of Statistics
Statistics
ISBN:9781319013387
Author:David S. Moore, George P. McCabe, Bruce A. Craig
Publisher:W. H. Freeman