MATLAB: An Introduction with Applications
6th Edition
ISBN: 9781119256830
Author: Amos Gilat
Publisher: John Wiley & Sons Inc
expand_more
expand_more
format_list_bulleted
Question

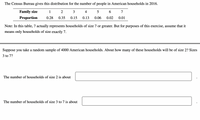
Transcribed Image Text:The Census Bureau gives this distribution for the number of people in American households in 2016.
Family size
1
2
4
6.
7
Proportion
0.28
0.35
0.15
0.13
0.06
0.02
0.01
Note: In this table, 7 actually represents households of size 7 or greater. But for purposes of this exercise, assume that it
means only households of size exactly 7.
Suppose you take a random sample of 4000 American households. About how many of these households will be of size 2? Sizes
3 to 7?
The number of households of size 2 is about
The number of households of size 3 to 7 is about
Expert Solution
This question has been solved!
Explore an expertly crafted, step-by-step solution for a thorough understanding of key concepts.
This is a popular solution
Trending nowThis is a popular solution!
Step by stepSolved in 2 steps with 2 images

Knowledge Booster
Similar questions
- Use the expression in the accompanying discussion of sample size to find the size of each sample if you want to estimate the difference between proportions of men and women who own smartphones. Assume that you want 95% confidence that your error is no more than 0.045. The sample should include how may men? and how manywomen?arrow_forwardq7- From a sample of 141 items, 21 are defective. The point estimate of the population proportion defective is: a. 0.2979 b. 0.0745 c. 0.0447 d. 0.1489arrow_forwardYou are the operations manager for an airline and you are considering a higher fare level for passengers in aisle seats. How many randomly selected air passengers must you survey? Assume that you want to be 95% confident that the sample percentage is within 4.5 percentage points of the true population percentage. Complete parts (a) and (b) below. a. Assume that nothing is known about the percentage of passengers who prefer aisle seats. n= (Round up to the nearest integer.) b. Assume that a prior survey suggests that about 37% of air passengers prefer an aisle seat. n = (Round up to the nearest integer.)arrow_forward
- 2.) ProportionsOn April 15th, 1912, the R.M.S. Titanic sank into the North Atlantic Ocean, resulting in the loss of more than 1,500 passengers and crew. Below is a table which summarizes the total number of passengers and the number of survivors for the crew, first-, second-, and third-class. Find the proportion of survivors by type of service (crew, first, second, third). Test the hypothesis at the 95% confidence level that the proportion of first-class survivors is the same as .50. What do you calculate for the test-statistic? What is the critical statistic? What is the conclusion of your hypothesis test? Class Passengers Survived Crew 885 212 First 325 202 Second 285 118 Third 706 178 Total 2201 710arrow_forwardHi could you answer the blanks?arrow_forwardCh 13arrow_forward
- Question 5 A survey of 1047 Americans found that 835 drive to work. a. What is n? b. What is x? c. Many textbooks use the symbol p to represent a sample proportion. What is p? Round to three decimals. Submit Question or MacBook Airarrow_forwardA researcher wants to determine the percentage given below. Describe how the researcher should apply the five basic steps in a statistical study. (Assume that all the people in the poll answered truthfully.) the percentage of volunteers that volunteer over 10 hours per week Determine how to apply the first basic step in a statistical study in this situation. Choose the correct answer below. A. The population is all volunteers that volunteer over 10 hours per week The researcher wants to estimate the number in this population that volunteer over 10 hours per week OB. The population is all volunteers. The researcher wants to estimate the percentage in this population that volunteer over 10 hours per week. C. The population is all volunteers that do not volunteer over 10 hours per week. The researcher wants to estimate the number in this population that do not volunteer over 10 hours per week. D. The population is all volunteers. The researcher wants to estimate the percentage in this…arrow_forwardfor b: add one more column with heading "proportion" and fill the numbers out with your calculationsarrow_forward
arrow_back_ios
SEE MORE QUESTIONS
arrow_forward_ios
Recommended textbooks for you
 MATLAB: An Introduction with ApplicationsStatisticsISBN:9781119256830Author:Amos GilatPublisher:John Wiley & Sons Inc
 Probability and Statistics for Engineering and th...StatisticsISBN:9781305251809Author:Jay L. DevorePublisher:Cengage Learning
 Statistics for The Behavioral Sciences (MindTap C...StatisticsISBN:9781305504912Author:Frederick J Gravetter, Larry B. WallnauPublisher:Cengage Learning
 Elementary Statistics: Picturing the World (7th E...StatisticsISBN:9780134683416Author:Ron Larson, Betsy FarberPublisher:PEARSON
 The Basic Practice of StatisticsStatisticsISBN:9781319042578Author:David S. Moore, William I. Notz, Michael A. FlignerPublisher:W. H. Freeman
 Introduction to the Practice of StatisticsStatisticsISBN:9781319013387Author:David S. Moore, George P. McCabe, Bruce A. CraigPublisher:W. H. Freeman

MATLAB: An Introduction with Applications
Statistics
ISBN:9781119256830
Author:Amos Gilat
Publisher:John Wiley & Sons Inc

Probability and Statistics for Engineering and th...
Statistics
ISBN:9781305251809
Author:Jay L. Devore
Publisher:Cengage Learning

Statistics for The Behavioral Sciences (MindTap C...
Statistics
ISBN:9781305504912
Author:Frederick J Gravetter, Larry B. Wallnau
Publisher:Cengage Learning

Elementary Statistics: Picturing the World (7th E...
Statistics
ISBN:9780134683416
Author:Ron Larson, Betsy Farber
Publisher:PEARSON

The Basic Practice of Statistics
Statistics
ISBN:9781319042578
Author:David S. Moore, William I. Notz, Michael A. Fligner
Publisher:W. H. Freeman

Introduction to the Practice of Statistics
Statistics
ISBN:9781319013387
Author:David S. Moore, George P. McCabe, Bruce A. Craig
Publisher:W. H. Freeman