MATLAB: An Introduction with Applications
6th Edition
ISBN: 9781119256830
Author: Amos Gilat
Publisher: John Wiley & Sons Inc
expand_more
expand_more
format_list_bulleted
Question

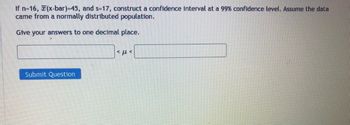
Transcribed Image Text:If n=16, (x-bar)=45, and s=17, construct a confidence interval at a 99% confidence level. Assume the data
came from a normally distributed population.
Give your answers to one decimal place.
Submit Question
*με
Expert Solution
This question has been solved!
Explore an expertly crafted, step-by-step solution for a thorough understanding of key concepts.
Step by stepSolved in 3 steps with 1 images

Knowledge Booster
Similar questions
- If n = 15, ¯xx¯ = 36, and s = 12, construct a confidence interval at a 90% confidence level. Assume the data came from a normally distributed population. Give your answers to three decimal places.arrow_forwardIf n=17, =40, and s=8, construct a confidence interval at a 92% confidence level. Assume the data came from a normally distributed population. Round z-values to 2 decimals, and round t-values to 3 decimals. Give your final answers to one decimal place. < Select an answer ♥arrow_forwardTina catches a 14-pound bass. She does not know the population mean or standard deviation. So she takes a sample of five friends and they say the last bass they caught was 9, 12, 13, 10, and 10 pounds. Find the t and calculate a 95% (α = .05) confidence interval.arrow_forward
- You measure 37 dogs' weights, and find they have a mean weight of 51 ounces. Assume the population standard deviation is 8.9 ounces. Based on this, construct a 99% confidence interval for the true population mean dog weight.Give your answers as decimals, to two placesarrow_forwardIf n=17, (x-bar)=48, and s=2, construct a confidence interval at a 80% confidence level. Assume the data came from a normally distributed population. Give your answers to one decimal place.arrow_forwardYou measure 25 turtles' weights, and find they have a mean weight of 46 ounces. Assume the population standard deviation is 3.2 ounces. Based on this, construct a 99% confidence interval for the true population mean turtle weight.Give your answers as decimals, to two placesarrow_forward
- Construct a 96% confidence interval if x=75 and n=200. Round your answers to 3 decimal places.arrow_forwardIf n 12, I = 40, and s = 16, construct a confidence interval at a 99% confidence level. Assume the data came from a normally distributed population. Give your answers to three decimal places. Submit Questionarrow_forwardIf n=16, ¯x (x-bar)=38, and s=12, construct a confidence interval at a 99% confidence level.arrow_forward
- If n=11, 7(x-bar)=45, and s=5, construct a confidence interval at a 95% confidence level. Assume the data came from a normally distributed population. Give your answers to one decimal place.arrow_forwardThe National Longitudinal Study of Adolescent Health interviewed several thousand teens (grades 7 to 12). One question asked was “What do you think are the chances you will be married in the next 10 years?” Here is a two-way table of the responses by gender: Opinion Female Male Almost no chance 120 94 Some chance but probably not 156 178 A 50-50 chance 427 498 A good chance 750 700 Almost certain 1176 770 How many individuals are described in this table? How many females were among the respondents? The percent of females among the respondents was about %. Your percent from the previous exercise is part of the marginal distribution of opinion about marriage. the conditional distribution of sex among adolescents with a given opinion. the marginal distribution of sex. What percent of females thought that they were almost certain to be married in the next 10 years?% Your percent from the previous exercise is part of the conditional distribution of sex among…arrow_forwardThe following table gives the average number of hours 5 junior high students were left unsupervised each day and their corresponding overall grade averages. Hours Unsupervised 2 2 4 6 6 Overall Grades 64 73 76 77 86 Show Transcribed Text Step 1 of 5: Calculate the sum of squared errors (SSE). Use the values = 62.2000 and b, 3.2500 for the calculations, Round your answer to three decimal places Table Copy Data Step 2 of 5: Calculate the estimated variance of errors. 2. Round your answer to three decimal places. Show Transcribed Text Step 3 of 5: Calculate the estimated variance of slope. s. Round your answer to three decimal places.arrow_forward
arrow_back_ios
SEE MORE QUESTIONS
arrow_forward_ios
Recommended textbooks for you
 MATLAB: An Introduction with ApplicationsStatisticsISBN:9781119256830Author:Amos GilatPublisher:John Wiley & Sons Inc
 Probability and Statistics for Engineering and th...StatisticsISBN:9781305251809Author:Jay L. DevorePublisher:Cengage Learning
 Statistics for The Behavioral Sciences (MindTap C...StatisticsISBN:9781305504912Author:Frederick J Gravetter, Larry B. WallnauPublisher:Cengage Learning
 Elementary Statistics: Picturing the World (7th E...StatisticsISBN:9780134683416Author:Ron Larson, Betsy FarberPublisher:PEARSON
 The Basic Practice of StatisticsStatisticsISBN:9781319042578Author:David S. Moore, William I. Notz, Michael A. FlignerPublisher:W. H. Freeman
 Introduction to the Practice of StatisticsStatisticsISBN:9781319013387Author:David S. Moore, George P. McCabe, Bruce A. CraigPublisher:W. H. Freeman

MATLAB: An Introduction with Applications
Statistics
ISBN:9781119256830
Author:Amos Gilat
Publisher:John Wiley & Sons Inc

Probability and Statistics for Engineering and th...
Statistics
ISBN:9781305251809
Author:Jay L. Devore
Publisher:Cengage Learning

Statistics for The Behavioral Sciences (MindTap C...
Statistics
ISBN:9781305504912
Author:Frederick J Gravetter, Larry B. Wallnau
Publisher:Cengage Learning

Elementary Statistics: Picturing the World (7th E...
Statistics
ISBN:9780134683416
Author:Ron Larson, Betsy Farber
Publisher:PEARSON

The Basic Practice of Statistics
Statistics
ISBN:9781319042578
Author:David S. Moore, William I. Notz, Michael A. Fligner
Publisher:W. H. Freeman

Introduction to the Practice of Statistics
Statistics
ISBN:9781319013387
Author:David S. Moore, George P. McCabe, Bruce A. Craig
Publisher:W. H. Freeman