Concept explainers
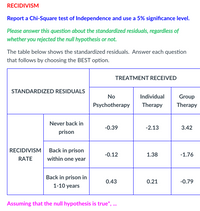
(i) ... which residual indicates that the observed proportion is closest to expected? [ Select ] ["-0.39", "-0.12", "3.42", "-0.79", "0.43", "0.21", "1.38", "-2.13", "-1.76"]
(ii) ... which residual indicates that the observed proportion is furthest from expected? [ Select ] ["-1.76", "3.42", "0.21", "-0.39", "0.43", "1.38", "-2.13", "-0.79", "-0.12"]
(iii) ... the percentage of offenders who received individual therapy and went back to prison in 1 year was [ Select ] ["lower", "higher"] than expected.
(iv) ... the percentage of offenders who received group therapy and went back to prison in 1 to 10 years was [ Select ] ["lower", "higher"] than expected.
(v) ... of the offenders who went back to prison in 1 to 10 years, the percentage who had received no psychotherapy was [ Select ] ["closer to", "further from"] expected than the percentage who had received individual therapy.
(vi) ... of the offenders who received individual therapy, the percentage who went back to prison in 1 year was [ Select ] ["further from", "closer to"] expected than the percentage who never went back to prison.
* I don't want to give away what the null hypothesis is, that is why I did not write it out in context.

Trending nowThis is a popular solution!
Step by stepSolved in 2 steps

- mean of the process is the estimate developed in part (a). Twenty-five samples of 100 items each were inspected when a process was considered to be operating satisfactorily. In the 25 samples, a total of 135 items were found to be defective. What is an estimate of the proportion defective when the process is in control? b. a. What is the standard error of the proportion if samples of size 100 will be used for statistical process control? Compute the upper and lower control limits for the control chart. C.arrow_forwardA new Economic / Social Conservatism Scale has scores between 0 and 30 (0 being extreme liberal, 30 being extreme conservative). The mean score is 21 and standard deviation of scores is 5. You want to convert the original scale (call it X) to a new scale (call it Y) that has scores between 0 and 100. What is the correlation of X and Y?arrow_forwardThe graph illustrates the distribution of test scores taken by College Aigebra students. The maximum possible score on the test was 140, while the mean score was 76 and the standard deviation was 14. 34 48 62 76 90 104 Distribution of Test Scores What is the approximate percentage of students who scored between 76 and 90 on the test? What is the approximate percentage of students who scored higher than 104 on the test? What is the appraximate percentage of students who scored higher than 118 on the test? What is the approximate percentage of students who scored between 48 and 104 on the test?arrow_forward
- 52. Multiple Choice If the calorie contents of robin eggs are normally distributed with a mean of 25 and a standard devia- tion of 1.2, then approximately 95% of all robin eggs should In have a calorie content in the interval ex (A) [21.4, 28.6]. (B) [22, 28]. (C) [22.6, 27.4]. (D) [23, 27]. (E) [23.8, 26.2].arrow_forwardQ1. A psychologist conducted a study on the relationship between introversion and shyness. The values are results for scales of introversion and shyness. High positive scores on each scale indicate high introversion or shyness; and high negative scores indicate low introversion or shyness. Data collected from 10 people as follows: Introversion 4 -7 -1 0 6 7 -4 -9 -5 8 Shyness 11 -7 -1 -3 0 7 -1 -8 -1 5 a) Compute the correlation coefficient relating introversion and shyness scores. b) Find the regression equation which predicts introversion from shyness. c) What introversion score would you predict from a shyness score of 7?arrow_forward
 MATLAB: An Introduction with ApplicationsStatisticsISBN:9781119256830Author:Amos GilatPublisher:John Wiley & Sons Inc
 Probability and Statistics for Engineering and th...StatisticsISBN:9781305251809Author:Jay L. DevorePublisher:Cengage Learning
 Statistics for The Behavioral Sciences (MindTap C...StatisticsISBN:9781305504912Author:Frederick J Gravetter, Larry B. WallnauPublisher:Cengage Learning
 Elementary Statistics: Picturing the World (7th E...StatisticsISBN:9780134683416Author:Ron Larson, Betsy FarberPublisher:PEARSON
 The Basic Practice of StatisticsStatisticsISBN:9781319042578Author:David S. Moore, William I. Notz, Michael A. FlignerPublisher:W. H. Freeman
 Introduction to the Practice of StatisticsStatisticsISBN:9781319013387Author:David S. Moore, George P. McCabe, Bruce A. CraigPublisher:W. H. Freeman


