
MATLAB: An Introduction with Applications
6th Edition
ISBN: 9781119256830
Author: Amos Gilat
Publisher: John Wiley & Sons Inc
expand_more
expand_more
format_list_bulleted
Related questions
Question

Transcribed Image Text:H.
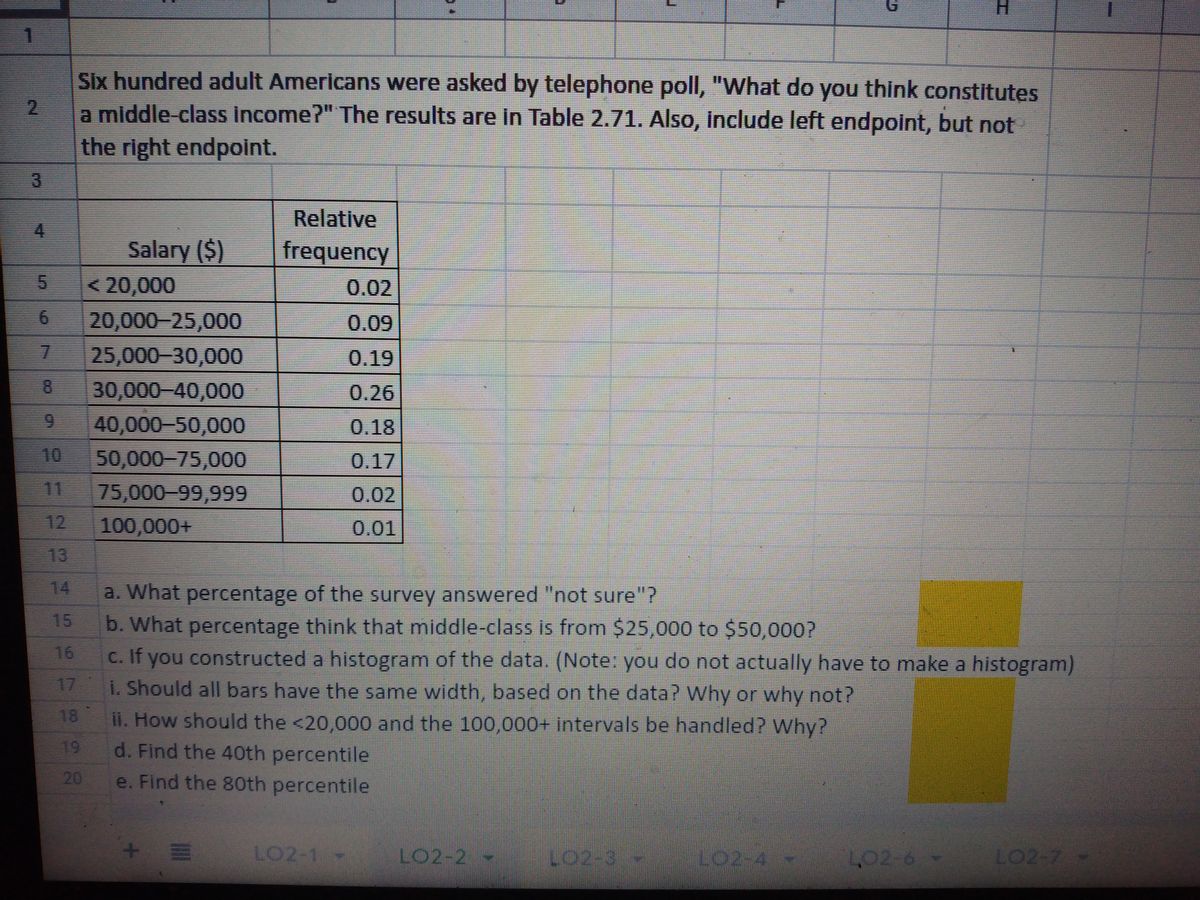
Six hundred adult Americans were asked by telephone poll, "What do you think constitutes
a mlddle-class income?" The results are in Table 2.71. Also, Include left endpoint, but not
the right endpoint.
Relative
4
Salary ($)
frequency
<20,000
0.02
6.
20,000-25,000
0.09
25,000-30,000
0.19
8.
30,000-40,000
0.26
40,000-50,000
0.18
10
50,000-75,000
0.17
11
75,000-99,999
0.02
12
100,000+
0.01
13
14
a. What percentage of the survey answered "not sure"?
b. What percentage think that middle-class is from $25,000 to $50,000?
c. If you constructed a histogram of the data. (Note: you do not actually have to make a histogram)
i. Should all bars have the same width, based on the data? Why or why not?
İi. How should the <20,000 and the 100,000+ intervals be handled? Why?
19
15
16
17
18
d. Find the 40th percentile
e. Find the 80th percentile
20
LO2-1-
LO2-2 -
LO2-3
L02-6 -
LO2-7
1.
2.
3.
Expert Solution
This question has been solved!
Explore an expertly crafted, step-by-step solution for a thorough understanding of key concepts.

This is a popular solution

Trending nowThis is a popular solution!

Step by stepSolved in 4 steps

Knowledge Booster

Similar questions
- Based on the following data set: 150, 180,210,220,250,325 What would be the change to the mean, median, and mode if 325 is changed to 150. Mean Median Mode Original Changedarrow_forwardWhat is the median?arrow_forwardFind the mean, median, and mode Scores F 95-99 10 90-94 20 85-89 25 80-84 28 75-79 12 70-74 8arrow_forward
arrow_back_ios
arrow_forward_ios
Recommended textbooks for you
- MATLAB: An Introduction with ApplicationsStatisticsISBN:9781119256830Author:Amos GilatPublisher:John Wiley & Sons Inc
 Probability and Statistics for Engineering and th...StatisticsISBN:9781305251809Author:Jay L. DevorePublisher:Cengage Learning
 Statistics for The Behavioral Sciences (MindTap C...StatisticsISBN:9781305504912Author:Frederick J Gravetter, Larry B. WallnauPublisher:Cengage Learning
  Elementary Statistics: Picturing the World (7th E...StatisticsISBN:9780134683416Author:Ron Larson, Betsy FarberPublisher:PEARSON
 The Basic Practice of StatisticsStatisticsISBN:9781319042578Author:David S. Moore, William I. Notz, Michael A. FlignerPublisher:W. H. Freeman
 Introduction to the Practice of StatisticsStatisticsISBN:9781319013387Author:David S. Moore, George P. McCabe, Bruce A. CraigPublisher:W. H. Freeman
MATLAB: An Introduction with Applications
Statistics
ISBN:9781119256830
Author:Amos Gilat
Publisher:John Wiley & Sons Inc
Probability and Statistics for Engineering and th...
Statistics
ISBN:9781305251809
Author:Jay L. Devore
Publisher:Cengage Learning
Statistics for The Behavioral Sciences (MindTap C...
Statistics
ISBN:9781305504912
Author:Frederick J Gravetter, Larry B. Wallnau
Publisher:Cengage Learning
Elementary Statistics: Picturing the World (7th E...
Statistics
ISBN:9780134683416
Author:Ron Larson, Betsy Farber
Publisher:PEARSON
The Basic Practice of Statistics
Statistics
ISBN:9781319042578
Author:David S. Moore, William I. Notz, Michael A. Fligner
Publisher:W. H. Freeman
Introduction to the Practice of Statistics
Statistics
ISBN:9781319013387
Author:David S. Moore, George P. McCabe, Bruce A. Craig
Publisher:W. H. Freeman