MATLAB: An Introduction with Applications
6th Edition
ISBN: 9781119256830
Author: Amos Gilat
Publisher: John Wiley & Sons Inc
expand_more
expand_more
format_list_bulleted
Question

Transcribed Image Text:12
6.
41
41
6.
Save & Exit Certify
Lesson: 2.2 Graphical Displays of Data
0/22
Question 1 of 8, Step 1 of 3
Correct
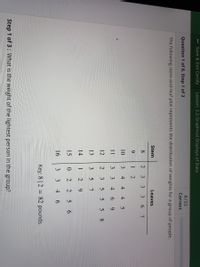
The following stem-and-leaf plot represents the distribution of weights for a group of people.
Stem
Leaves
8
3 36 7
1
10
3
4
4
11
3.
3
6.
558
13
3
5
14
1
2.
9.
15
0.
16
3
3
4
6.
Key: 8|2 = 82 pounds
%3D
Step 1 of 3: What is the weight of the lightest person in the group?
Expert Solution
This question has been solved!
Explore an expertly crafted, step-by-step solution for a thorough understanding of key concepts.
This is a popular solution
Trending nowThis is a popular solution!
Step by stepSolved in 2 steps

Knowledge Booster
Similar questions
- < Prev The following stem-and-leaf plot represents the distribution of weights for a group of people. Stem 9 10 11 12 13 14 15 16 17 1 1 4 6 3 Step 1 of 3: What is the weight of the lightest person in the group? 7 Leaves 7 8 4 4 4 19 6 7 2 2 2 3 1 2 6 7 7 2 5 5 1 1 2 4 4 5 1 1 1 2 5 6 7 8 0 1 2 6 8 1567 Key: 911 91 poundsarrow_forwardThe box plot indicates that the weight distribution of the rats is?arrow_forwardplease answer number 1arrow_forward
- I need help calculating the population size (n), sum, mean, median, mode, range, std. deviation and coef. of variation.arrow_forwardStep 4 The following table summarizes the given data and the forecast values. There will not be a forecast error for the first month. Complete the columns for the forecast error and squared forecast error. Month Value Forecast Value 1 2 3 4 5 6 7 19 27 23 28 24 23 28 19 23 23 24.25 24.2 24 Forecast Error Actual - Forecast Submit Skip (you cannot come back) 27 19 = 8 0 5 -0.25 4 Total Squared Forecast Error (Actual - Forecast)² (8)² = 64 0 1.44 The MSE will be the average of the squared forecast error column. Find the average of this column, rounding the result to two decimal places. MSE =arrow_forwardQuestions 1 and 2 use the X and Y data below. You can think of this data as representing the heights of 5 individuals (labelled A,B,C,D,E) at ages 11 (X column) and 12 (Y column). Obs X Y Paired Y-X A 60 62 B 61 62 C 62 63 D 63 64 E 64 66 The means and variances for X and Y are shown below. (You can verify to practice calculation steps.) X Mean: 62, X Variance: 2.5 | Y Mean: 63.4, Y Variance: 2.8 The Y - X difference column has not been computed. You need to fill this out and compute the corresponding mean and variance (for Y-X) for question 2 1) Test whether the population mean of Y is no greater than 1/2 (0.5) unit higher than the population mean for X as the null hypothesis (Ho) vs the population mean of Y is more than 1/2 unit greater than the population mean for X as the alternative hypothesis (H1). What is the small sample t statistic for the test of Ho? Round to two decimal places (e.g., 1.23) Assume the measurements…arrow_forward
- Step by step I need solving solution of part C and D F pleasearrow_forwardThe following stem-and-leaf plot represents the prices in dollars of general admission tickets for the last 18 concerts at one venue. Use the data provided to find the quartiles, Ticket Prices in Dollars Stem Leaves 4 134 6 8 0 4 6. 1 1 2 2 3 4 5 6 179 Key: 4|1 = 41 Copy Data Step 1 of 3: Find the second quartile. Answer How to enter your answer E Tables Keypad Keyboard Shortcuts Submit Answer © 2021 Hawkes Learning JAN 30 tv W 617arrow_forward
arrow_back_ios
arrow_forward_ios
Recommended textbooks for you
 MATLAB: An Introduction with ApplicationsStatisticsISBN:9781119256830Author:Amos GilatPublisher:John Wiley & Sons Inc
 Probability and Statistics for Engineering and th...StatisticsISBN:9781305251809Author:Jay L. DevorePublisher:Cengage Learning
 Statistics for The Behavioral Sciences (MindTap C...StatisticsISBN:9781305504912Author:Frederick J Gravetter, Larry B. WallnauPublisher:Cengage Learning
 Elementary Statistics: Picturing the World (7th E...StatisticsISBN:9780134683416Author:Ron Larson, Betsy FarberPublisher:PEARSON
 The Basic Practice of StatisticsStatisticsISBN:9781319042578Author:David S. Moore, William I. Notz, Michael A. FlignerPublisher:W. H. Freeman
 Introduction to the Practice of StatisticsStatisticsISBN:9781319013387Author:David S. Moore, George P. McCabe, Bruce A. CraigPublisher:W. H. Freeman

MATLAB: An Introduction with Applications
Statistics
ISBN:9781119256830
Author:Amos Gilat
Publisher:John Wiley & Sons Inc

Probability and Statistics for Engineering and th...
Statistics
ISBN:9781305251809
Author:Jay L. Devore
Publisher:Cengage Learning

Statistics for The Behavioral Sciences (MindTap C...
Statistics
ISBN:9781305504912
Author:Frederick J Gravetter, Larry B. Wallnau
Publisher:Cengage Learning

Elementary Statistics: Picturing the World (7th E...
Statistics
ISBN:9780134683416
Author:Ron Larson, Betsy Farber
Publisher:PEARSON

The Basic Practice of Statistics
Statistics
ISBN:9781319042578
Author:David S. Moore, William I. Notz, Michael A. Fligner
Publisher:W. H. Freeman

Introduction to the Practice of Statistics
Statistics
ISBN:9781319013387
Author:David S. Moore, George P. McCabe, Bruce A. Craig
Publisher:W. H. Freeman