MATLAB: An Introduction with Applications
6th Edition
ISBN: 9781119256830
Author: Amos Gilat
Publisher: John Wiley & Sons Inc
expand_more
expand_more
format_list_bulleted
Question

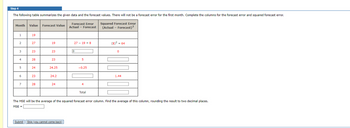
Transcribed Image Text:Step 4
The following table summarizes the given data and the forecast values. There will not be a forecast error for the first month. Complete the columns for the forecast error and squared forecast error.
Month Value Forecast Value
1
2
3
4
5
6
7
19
27
23
28
24
23
28
19
23
23
24.25
24.2
24
Forecast Error
Actual - Forecast
Submit Skip (you cannot come back)
27 19 = 8
0
5
-0.25
4
Total
Squared Forecast Error
(Actual - Forecast)²
(8)² = 64
0
1.44
The MSE will be the average of the squared forecast error column. Find the average of this column, rounding the result to two decimal places.
MSE =
Expert Solution
This question has been solved!
Explore an expertly crafted, step-by-step solution for a thorough understanding of key concepts.
Step by stepSolved in 3 steps

Knowledge Booster
Similar questions
- Perform a complete analysis of this data using the plots and descriptive statistics you generated. You should write your analysis as though it is intended for someone who knows absolutely nothing about this data. You may use the following questions as a starting point to help guide your analysis: What do the data points in both columns represent? Are the data skewed? How do the data compare to one another? (Variation, median, etc.)arrow_forwardModule 6, Lessons 8-12 1. A dot plot of times that five students studied for 3 test is displaye below. Studying for a Test 1.0 1.5 2.0 2.5 3,0 3.5 4.0 5.0 Study Time (hours) a. Calculate the mean number of hours that these five students studied. Then, use the mean to calculate the absolute deviations, and complete the table. Student Aria Ben Chloe Dellan Emma Number of Study Hours 1.5 4.5 Absolute Deviation b. Find and interpret the MAD for this data set.arrow_forwardState whether the quantity described is a parameter or a statistic and give the correct notation.Average number of television sets per household in North Carolina, using data from a sample of 1100 households.arrow_forward
- Typed and correct answer please. I will rate accordingly.arrow_forwardHi! I need help solving the attached question. This is my first time using Bartleby so please let me know if you need other info. I added the excel data file for you as well. Physician 1 Physician 2 Physician 3 Physician 4 34 33 17 28 25 35 30 33 27 31 30 31 31 31 26 27 26 42 32 32 34 33 28 33 21 26 40 29 Thanks!arrow_forwardPlease see attachment for math question.arrow_forward
- Find the percentil for the data point. Data set: 5 12 9 7 5 5 12 7 5 12 2 12 15 6 9 5 12 9 7 12;data point 6arrow_forwardServings Grams 1 11 2 15 3 23 4 29 5 19 6 22 7 21 8 20 9 15 10 25 11 17 complete a descriptive statistics and box-and-whiskers diagram in excel for the table.arrow_forwardHelp with MD and Interquartile.arrow_forward
arrow_back_ios
SEE MORE QUESTIONS
arrow_forward_ios
Recommended textbooks for you
 MATLAB: An Introduction with ApplicationsStatisticsISBN:9781119256830Author:Amos GilatPublisher:John Wiley & Sons Inc
 Probability and Statistics for Engineering and th...StatisticsISBN:9781305251809Author:Jay L. DevorePublisher:Cengage Learning
 Statistics for The Behavioral Sciences (MindTap C...StatisticsISBN:9781305504912Author:Frederick J Gravetter, Larry B. WallnauPublisher:Cengage Learning
 Elementary Statistics: Picturing the World (7th E...StatisticsISBN:9780134683416Author:Ron Larson, Betsy FarberPublisher:PEARSON
 The Basic Practice of StatisticsStatisticsISBN:9781319042578Author:David S. Moore, William I. Notz, Michael A. FlignerPublisher:W. H. Freeman
 Introduction to the Practice of StatisticsStatisticsISBN:9781319013387Author:David S. Moore, George P. McCabe, Bruce A. CraigPublisher:W. H. Freeman

MATLAB: An Introduction with Applications
Statistics
ISBN:9781119256830
Author:Amos Gilat
Publisher:John Wiley & Sons Inc

Probability and Statistics for Engineering and th...
Statistics
ISBN:9781305251809
Author:Jay L. Devore
Publisher:Cengage Learning

Statistics for The Behavioral Sciences (MindTap C...
Statistics
ISBN:9781305504912
Author:Frederick J Gravetter, Larry B. Wallnau
Publisher:Cengage Learning

Elementary Statistics: Picturing the World (7th E...
Statistics
ISBN:9780134683416
Author:Ron Larson, Betsy Farber
Publisher:PEARSON

The Basic Practice of Statistics
Statistics
ISBN:9781319042578
Author:David S. Moore, William I. Notz, Michael A. Fligner
Publisher:W. H. Freeman

Introduction to the Practice of Statistics
Statistics
ISBN:9781319013387
Author:David S. Moore, George P. McCabe, Bruce A. Craig
Publisher:W. H. Freeman