
MATLAB: An Introduction with Applications
6th Edition
ISBN: 9781119256830
Author: Amos Gilat
Publisher: John Wiley & Sons Inc
expand_more
expand_more
format_list_bulleted
Related questions
Question
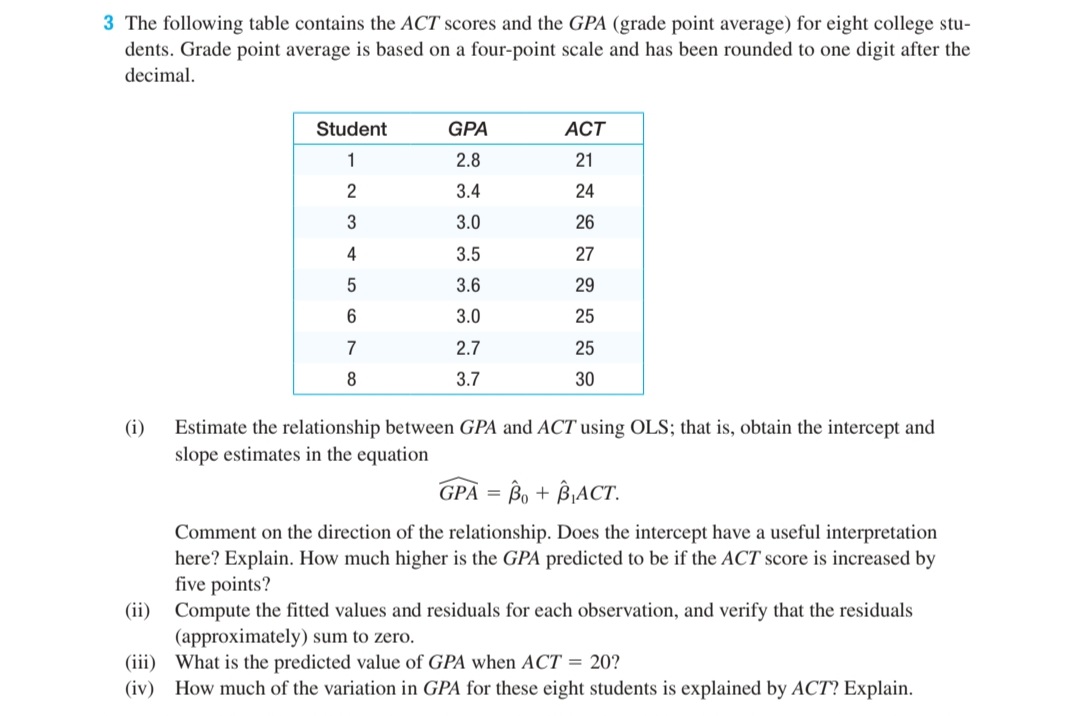

Transcribed Image Text:3 The following table contains the ACT scores and the GPA (grade point average) for eight college stu-
dents. Grade point average is based on a four-point scale and has been rounded to one digit after the
decimal.
Student
GPA
ACT
1
2.8
21
2
3.4
24
3
3.0
26
4
3.5
27
3.6
29
3.0
25
7
2.7
25
8
3.7
30
(i)
Estimate the relationship between GPA and ACT using OLS; that is, obtain the intercept and
slope estimates in the equation
GPA = Bo + B¡ACT.
Comment on the direction of the relationship. Does the intercept have a useful interpretation
here? Explain. How much higher is the GPA predicted to be if the ACT score is increased by
five points?
(ii) Compute the fitted values and residuals for each observation, and verify that the residuals
(approximately) sum to zero.
(iii) What is the predicted value of GPA when ACT = 20?
(iv) How much of the variation in GPA for these eight students is explained by ACT? Explain.
Expert Solution
This question has been solved!
Explore an expertly crafted, step-by-step solution for a thorough understanding of key concepts.

Step by stepSolved in 6 steps with 13 images

Knowledge Booster

Similar questions
- Which is correct?arrow_forwardA regression was run to determine if there is a relationship between hours of TV watched per day (x) and number of situps a person can do (y). The results of the regression were: y=ax+b a=-1.271 b=39.101 ²-0.407044 r=-0.638 Assume the correlation is significant, and use this to predict the number of situps a person who watches 14 hours of TV can do (to one decimal place) Aftarrow_forwardState the regression equation and use it to predict taxes for a house with lot size 10K.arrow_forward
- The following data gives the number of employees at the bookstore and the number of minutes students wait in line to buy books at the beginning of the term. The independent variable is the number of employees and the dependent variable is the number of minutes. What is the y intercept? SSxx = 56.857; SS=2095.714; SSxy=-322.571 SUMMARY OUTPUT Regression Statistics Multiple R R Square Adjusted R Square XA356899 0.96 0.93 0.91 y 67 54 47 33 31 25 12arrow_forwardListed below are the overhead widths (cm) of seals measured from photographs and weights (kg) of the seals. Find the regression equation, letting the overhead width be the predictor (x) variable. Find the best predicted weight of a seal if the overhead width measured from a photograph is 1.8 cm, using the regression equation. Can the prediction be correct? If not, what is wrong? Use a significance level of 0.05. Overhead Width (cm) 7.3 7.4 9.8 9.5 8.8 8.5 Weight (kg) 152 187 286 247 237 231 The regression equation is y =+ (x. (Round the y-intercept to the nearest integer as needed. Round the slope to one decimal place as needed.)arrow_forwardThe regression equation is: ŷ = 67.16 + 8.417x where ŷ is the miles traveled, and x is the MPG. The sample size used was all 110 MPG records. The correlation coefficient r = 0.620. Use the information to obtain an estimate of my mileage if my MPG is 22. Is it option: a.) cannot estimate ŷ rcrit = 0.195; the correlation IS NOT significant b.) ŷ = 252.33 rcrit = 0.195; the correlation IS significant c.) ŷ = 252.33 rcrit = 0.187; the correlation IS significant d.) cannot estimate ŷ rcrit = 0.187; the correlation IS NOT significantarrow_forward
- The following data represent the number of flash drives sold per day at a localcomputer shop and their prices.Price Units Sold34 336 432 635 530 938 240 1a. Develop the estimated regression equation that could be used to predict thequantity sold given the price. Interpret the slope.b. Did the estimated regression equation provide a good fit? Explain.c. Compute the sample correlation coefficient between the price and the number offlash drives sold. Use a= 0.01 to test the relationship between price and units sold.d. How many units can be sold per day if the price of flash drive is set to $28.arrow_forwardC) If Ariel converted her variables into standard deviation units and then computed her regression equation, what would her slope and intercept be?arrow_forwardThe following table contains ACT scores and the GPA for eight college students. Estimate the relationship between GPA (yi) and ACT (x;) using OLS regression by hand. Report the intercept and slope estimates: Student 1 2 3 4 5 6 7 8 GPA 2.8 3.4 3.0 3.5 3.6 3.0 2.7 3.7 ŷ₁ =B₁ + B₁x₁ ACT 21 24 26 27 29 25 25 30 y X ŷ₁arrow_forward
arrow_back_ios
arrow_forward_ios
Recommended textbooks for you
- MATLAB: An Introduction with ApplicationsStatisticsISBN:9781119256830Author:Amos GilatPublisher:John Wiley & Sons Inc
 Probability and Statistics for Engineering and th...StatisticsISBN:9781305251809Author:Jay L. DevorePublisher:Cengage Learning
 Statistics for The Behavioral Sciences (MindTap C...StatisticsISBN:9781305504912Author:Frederick J Gravetter, Larry B. WallnauPublisher:Cengage Learning
  Elementary Statistics: Picturing the World (7th E...StatisticsISBN:9780134683416Author:Ron Larson, Betsy FarberPublisher:PEARSON
 The Basic Practice of StatisticsStatisticsISBN:9781319042578Author:David S. Moore, William I. Notz, Michael A. FlignerPublisher:W. H. Freeman
 Introduction to the Practice of StatisticsStatisticsISBN:9781319013387Author:David S. Moore, George P. McCabe, Bruce A. CraigPublisher:W. H. Freeman
MATLAB: An Introduction with Applications
Statistics
ISBN:9781119256830
Author:Amos Gilat
Publisher:John Wiley & Sons Inc
Probability and Statistics for Engineering and th...
Statistics
ISBN:9781305251809
Author:Jay L. Devore
Publisher:Cengage Learning
Statistics for The Behavioral Sciences (MindTap C...
Statistics
ISBN:9781305504912
Author:Frederick J Gravetter, Larry B. Wallnau
Publisher:Cengage Learning
Elementary Statistics: Picturing the World (7th E...
Statistics
ISBN:9780134683416
Author:Ron Larson, Betsy Farber
Publisher:PEARSON
The Basic Practice of Statistics
Statistics
ISBN:9781319042578
Author:David S. Moore, William I. Notz, Michael A. Fligner
Publisher:W. H. Freeman
Introduction to the Practice of Statistics
Statistics
ISBN:9781319013387
Author:David S. Moore, George P. McCabe, Bruce A. Craig
Publisher:W. H. Freeman