
MATLAB: An Introduction with Applications
6th Edition
ISBN: 9781119256830
Author: Amos Gilat
Publisher: John Wiley & Sons Inc
expand_more
expand_more
format_list_bulleted
Related questions
Concept explainers
Question
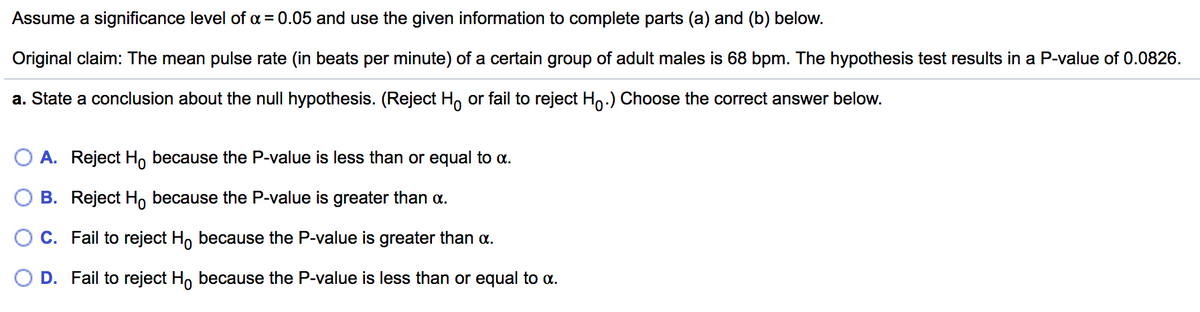

Transcribed Image Text:Assume a significance level of a = 0.05 and use the given information to complete parts (a) and (b) below.
Original claim: The mean pulse rate (in beats per minute) of a certain group of adult males is 68 bpm. The hypothesis test results in a P-value of 0.0826.
a. State a conclusion about the null hypothesis. (Reject H, or fail to reject Ho.) Choose the correct answer below.
O A. Reject H, because the P-value is less than or equal to a.
B. Reject H, because the P-value is greater than a.
C. Fail to reject H, because the P-value is greater than a.
D. Fail to reject Ho because the P-value is less than or equal to a.
Expert Solution
This question has been solved!
Explore an expertly crafted, step-by-step solution for a thorough understanding of key concepts.

This is a popular solution

Trending nowThis is a popular solution!

Step by stepSolved in 2 steps with 1 images

Knowledge Booster


Learn more about
Need a deep-dive on the concept behind this application? Look no further. Learn more about this topic, statistics and related others by exploring similar questions and additional content below.Similar questions
- Which of the following is the correct null hypothesis for a directional independent-samples t-test predicting a decrease in scores for the first condition? O Hou₁ > U2 O H₁ u₁> U₂ O Ho : X₁ > X₂ O H₁u₁ ≤ U₂ O Hou₁ < U₂arrow_forwardA formal hypothesis test is to be conducted using the claim that the mean AC thermostat setting in restaurants is equal to 74° F. What is the null hypothesis and how is it denoted? Group of answer choices H0 : p = 74°F H0 : p < 74°F H0 : μ = 74°F H0 : μ ≠ 74°Farrow_forwardAssume that the classes are successful but the conclusion is reached that the classes might not be successful. Which type of error is this?arrow_forward
- A hypothesis test is conducted with H0:μ=55 and H1:μ>55 A simple random sample of size n=64 is drawn, with x¯=62, and s=18.Compute the test statistic. (Round to two decimal places.) Determine the P-value. (Round to four decimals places.)arrow_forwardOnly numbers 3 and 4arrow_forwardHelp please!arrow_forward
- Your friend at UCSB claims that Cal Poly students are tall. He looks up the average height of people in the United States and finds that it is 65 inches. You take a random sample of 54 CP students and find that their average height is 66 inches with a standard deviation of 1.8 inches.arrow_forward5 a. Perform a Chi-square test Goodness of Fit test on following data to see whether Republicans and Democrats are equally represented in the sample. Report the resulting chi-square number. What is your political affiliation? Republican 102 Democrat 98 200 = QUESTION 5 B Given the chi-square number for the question above, find the associated p-value and indicate the conclusion with regard to H0/H1. We accept H1. We accept H0. We do not reject H1. We do not reject H0.arrow_forwardBased on the Cl for the difference you see in this figure, you know that in the NHST approach: Interview Interest 14 12 10 6 2 B Male My Female M www A 2 0 Difference -2 -4 O This is a statistically significant result, p 0.05, fail to reject the null. O Both of the above. O No conclusions can be drawn about the NHST approach-this approach do not apply to paired designs.arrow_forward
- A company wants to reduce heat generated in their factory by chainging the oil they use. Nominal engine temperature remains at 135 C. Data generated from experiment are shown below. Based on this data perform a T-Test to determine if engine temperature is lower that 135 C. Please indicate your null and alternative hypotheses as well as type of T test performed. Run Temp (C) 1 130 2 132 3 133 4 128 5 136 6 129 7 131arrow_forwardIf the α-level (alpha level) is made larger, then: Group of answer choices The P-value will be smaller, as well. The hypothesis test will most likely be two-sided. The null hypothesis is less likely to be rejected. The null hypothesis is more likely to be rejected.arrow_forwardYou are conducting a multinomial hypothesis test for the claim that the 4 categories occur with the following frequencies:Ho : pA=0.2 pB=0.3; pC=0.1; pD=0.4Complete the table. Category ObservedFrequency ExpectedFrequency SquaredResidual A 38 B 41 C 10 D 57 What is the chi-square test-statistic for this data?χ2=Report all answers accurate to three decimal places.VERY IMPORTANT NOTE: Answers are reported to 3 decimal places, but you should use all the decimal places to calculate the final chi-square test statistic...DO NOT use the rounded number you report in the table.arrow_forward
arrow_back_ios
SEE MORE QUESTIONS
arrow_forward_ios
Recommended textbooks for you
- MATLAB: An Introduction with ApplicationsStatisticsISBN:9781119256830Author:Amos GilatPublisher:John Wiley & Sons Inc
 Probability and Statistics for Engineering and th...StatisticsISBN:9781305251809Author:Jay L. DevorePublisher:Cengage Learning
 Statistics for The Behavioral Sciences (MindTap C...StatisticsISBN:9781305504912Author:Frederick J Gravetter, Larry B. WallnauPublisher:Cengage Learning
  Elementary Statistics: Picturing the World (7th E...StatisticsISBN:9780134683416Author:Ron Larson, Betsy FarberPublisher:PEARSON
 The Basic Practice of StatisticsStatisticsISBN:9781319042578Author:David S. Moore, William I. Notz, Michael A. FlignerPublisher:W. H. Freeman
 Introduction to the Practice of StatisticsStatisticsISBN:9781319013387Author:David S. Moore, George P. McCabe, Bruce A. CraigPublisher:W. H. Freeman
MATLAB: An Introduction with Applications
Statistics
ISBN:9781119256830
Author:Amos Gilat
Publisher:John Wiley & Sons Inc
Probability and Statistics for Engineering and th...
Statistics
ISBN:9781305251809
Author:Jay L. Devore
Publisher:Cengage Learning
Statistics for The Behavioral Sciences (MindTap C...
Statistics
ISBN:9781305504912
Author:Frederick J Gravetter, Larry B. Wallnau
Publisher:Cengage Learning
Elementary Statistics: Picturing the World (7th E...
Statistics
ISBN:9780134683416
Author:Ron Larson, Betsy Farber
Publisher:PEARSON
The Basic Practice of Statistics
Statistics
ISBN:9781319042578
Author:David S. Moore, William I. Notz, Michael A. Fligner
Publisher:W. H. Freeman
Introduction to the Practice of Statistics
Statistics
ISBN:9781319013387
Author:David S. Moore, George P. McCabe, Bruce A. Craig
Publisher:W. H. Freeman