
MATLAB: An Introduction with Applications
6th Edition
ISBN: 9781119256830
Author: Amos Gilat
Publisher: John Wiley & Sons Inc
expand_more
expand_more
format_list_bulleted
Related questions
Question

Transcribed Image Text:8
DEN
NLD
CAN AUS
AUT
CHE
7.5
NOR
ISR
FIN
SWE
FRA
BEL
7
МЕХ
USA
KOR
ISL
GBR
IRL
1 CHL
DEU
6.5
CZE
ESP
ITA
"SVN
JAP
ISVK
POL
5.5
EST
PRT
GRC
5
HUN
4.5
10000
20000
30000
40000
50000
60000
GDP per capita PPP US$
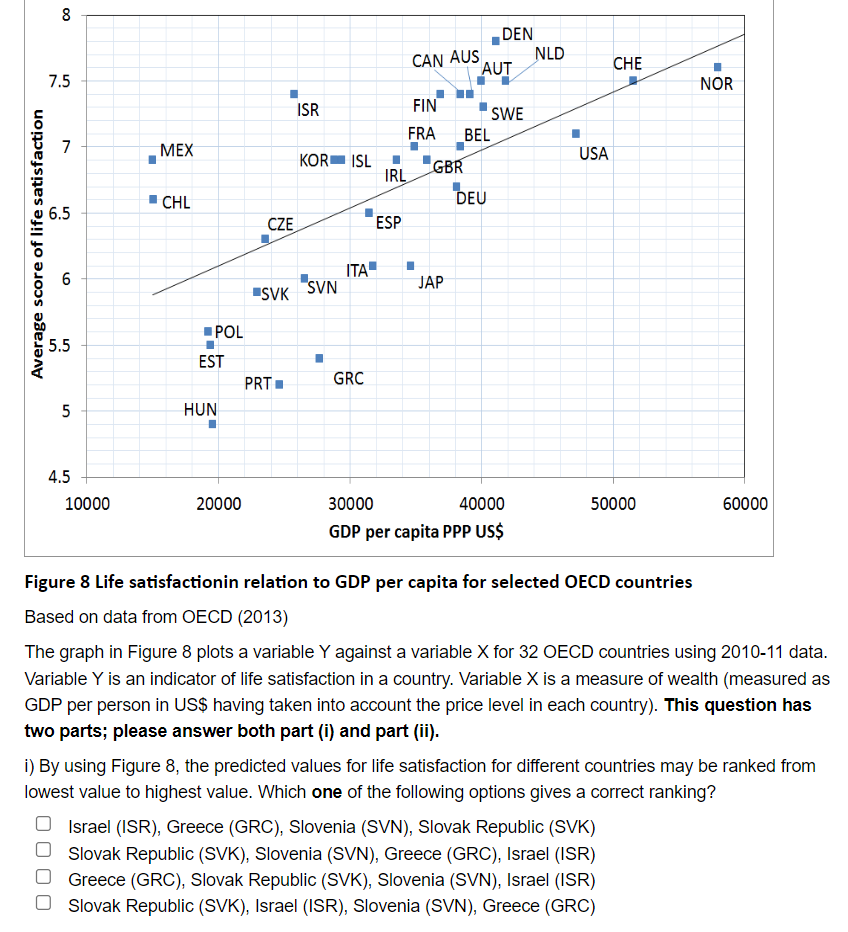
Figure 8 Life satisfactionin relation to GDP per capita for selected OECD countries
Based on data from OECD (2013)
The graph in Figure 8 plots a variable Y against a variable X for 32 OECD countries using 2010-11 data.
Variable Y is an indicator of life satisfaction in a country. Variable X is a measure of wealth (measured as
GDP per person in US$ having taken into account the price level in each country). This question has
two parts; please answer both part (i) and part (ii).
i) By using Figure 8, the predicted values for life satisfaction for different countries may be ranked from
lowest value to highest value. Which one of the following options gives a correct ranking?
Israel (ISR), Greece (GRC), Slovenia (SVN), Slovak Republic (SVK)
Slovak Republic (SVK), Slovenia (SVN), Greece (GRC), Israel (ISR)
Greece (GRC), Slovak Republic (SVK), Slovenia (SVN), Israel (ISR)
Slovak Republic (SVK), Israel (ISR), Slovenia (SVN), Greece (GRC)
Average score of life satisfaction
Expert Solution
This question has been solved!
Explore an expertly crafted, step-by-step solution for a thorough understanding of key concepts.

Step by stepSolved in 2 steps

Knowledge Booster

Similar questions
- Answer it correctly and explain well. I will rate accordingly.arrow_forwardIf the median of a data set is 760, the upper quartile is 950, and the lower quartile is 650, what is the interquartile range?arrow_forwardIn a data set with 25 scores, if the value 16 occurs 12 times, what is its relative frequency?arrow_forward
- if a study determines the difference in average salary for subpopulations of people with blue eyes and people with brown eyes is not significant then the populations are blue-eyed people and brown-eyed people are what different salariesarrow_forwardPlease help with part d. Thanks!arrow_forwardA report states that the mean household income last year for a certain rural county was $55,300 and the median was $62,800. If a histogram were constructed for the incomes of all households in the county, would you expect it to be skewed to the right, skewed to the left, or approximately symmetric? Answer is Blank 1 ( don't hand writing solution)arrow_forward
arrow_back_ios
arrow_forward_ios
Recommended textbooks for you
- MATLAB: An Introduction with ApplicationsStatisticsISBN:9781119256830Author:Amos GilatPublisher:John Wiley & Sons Inc
 Probability and Statistics for Engineering and th...StatisticsISBN:9781305251809Author:Jay L. DevorePublisher:Cengage Learning
 Statistics for The Behavioral Sciences (MindTap C...StatisticsISBN:9781305504912Author:Frederick J Gravetter, Larry B. WallnauPublisher:Cengage Learning
  Elementary Statistics: Picturing the World (7th E...StatisticsISBN:9780134683416Author:Ron Larson, Betsy FarberPublisher:PEARSON
 The Basic Practice of StatisticsStatisticsISBN:9781319042578Author:David S. Moore, William I. Notz, Michael A. FlignerPublisher:W. H. Freeman
 Introduction to the Practice of StatisticsStatisticsISBN:9781319013387Author:David S. Moore, George P. McCabe, Bruce A. CraigPublisher:W. H. Freeman
MATLAB: An Introduction with Applications
Statistics
ISBN:9781119256830
Author:Amos Gilat
Publisher:John Wiley & Sons Inc
Probability and Statistics for Engineering and th...
Statistics
ISBN:9781305251809
Author:Jay L. Devore
Publisher:Cengage Learning
Statistics for The Behavioral Sciences (MindTap C...
Statistics
ISBN:9781305504912
Author:Frederick J Gravetter, Larry B. Wallnau
Publisher:Cengage Learning
Elementary Statistics: Picturing the World (7th E...
Statistics
ISBN:9780134683416
Author:Ron Larson, Betsy Farber
Publisher:PEARSON
The Basic Practice of Statistics
Statistics
ISBN:9781319042578
Author:David S. Moore, William I. Notz, Michael A. Fligner
Publisher:W. H. Freeman
Introduction to the Practice of Statistics
Statistics
ISBN:9781319013387
Author:David S. Moore, George P. McCabe, Bruce A. Craig
Publisher:W. H. Freeman