MATLAB: An Introduction with Applications
6th Edition
ISBN: 9781119256830
Author: Amos Gilat
Publisher: John Wiley & Sons Inc
expand_more
expand_more
format_list_bulleted
Question

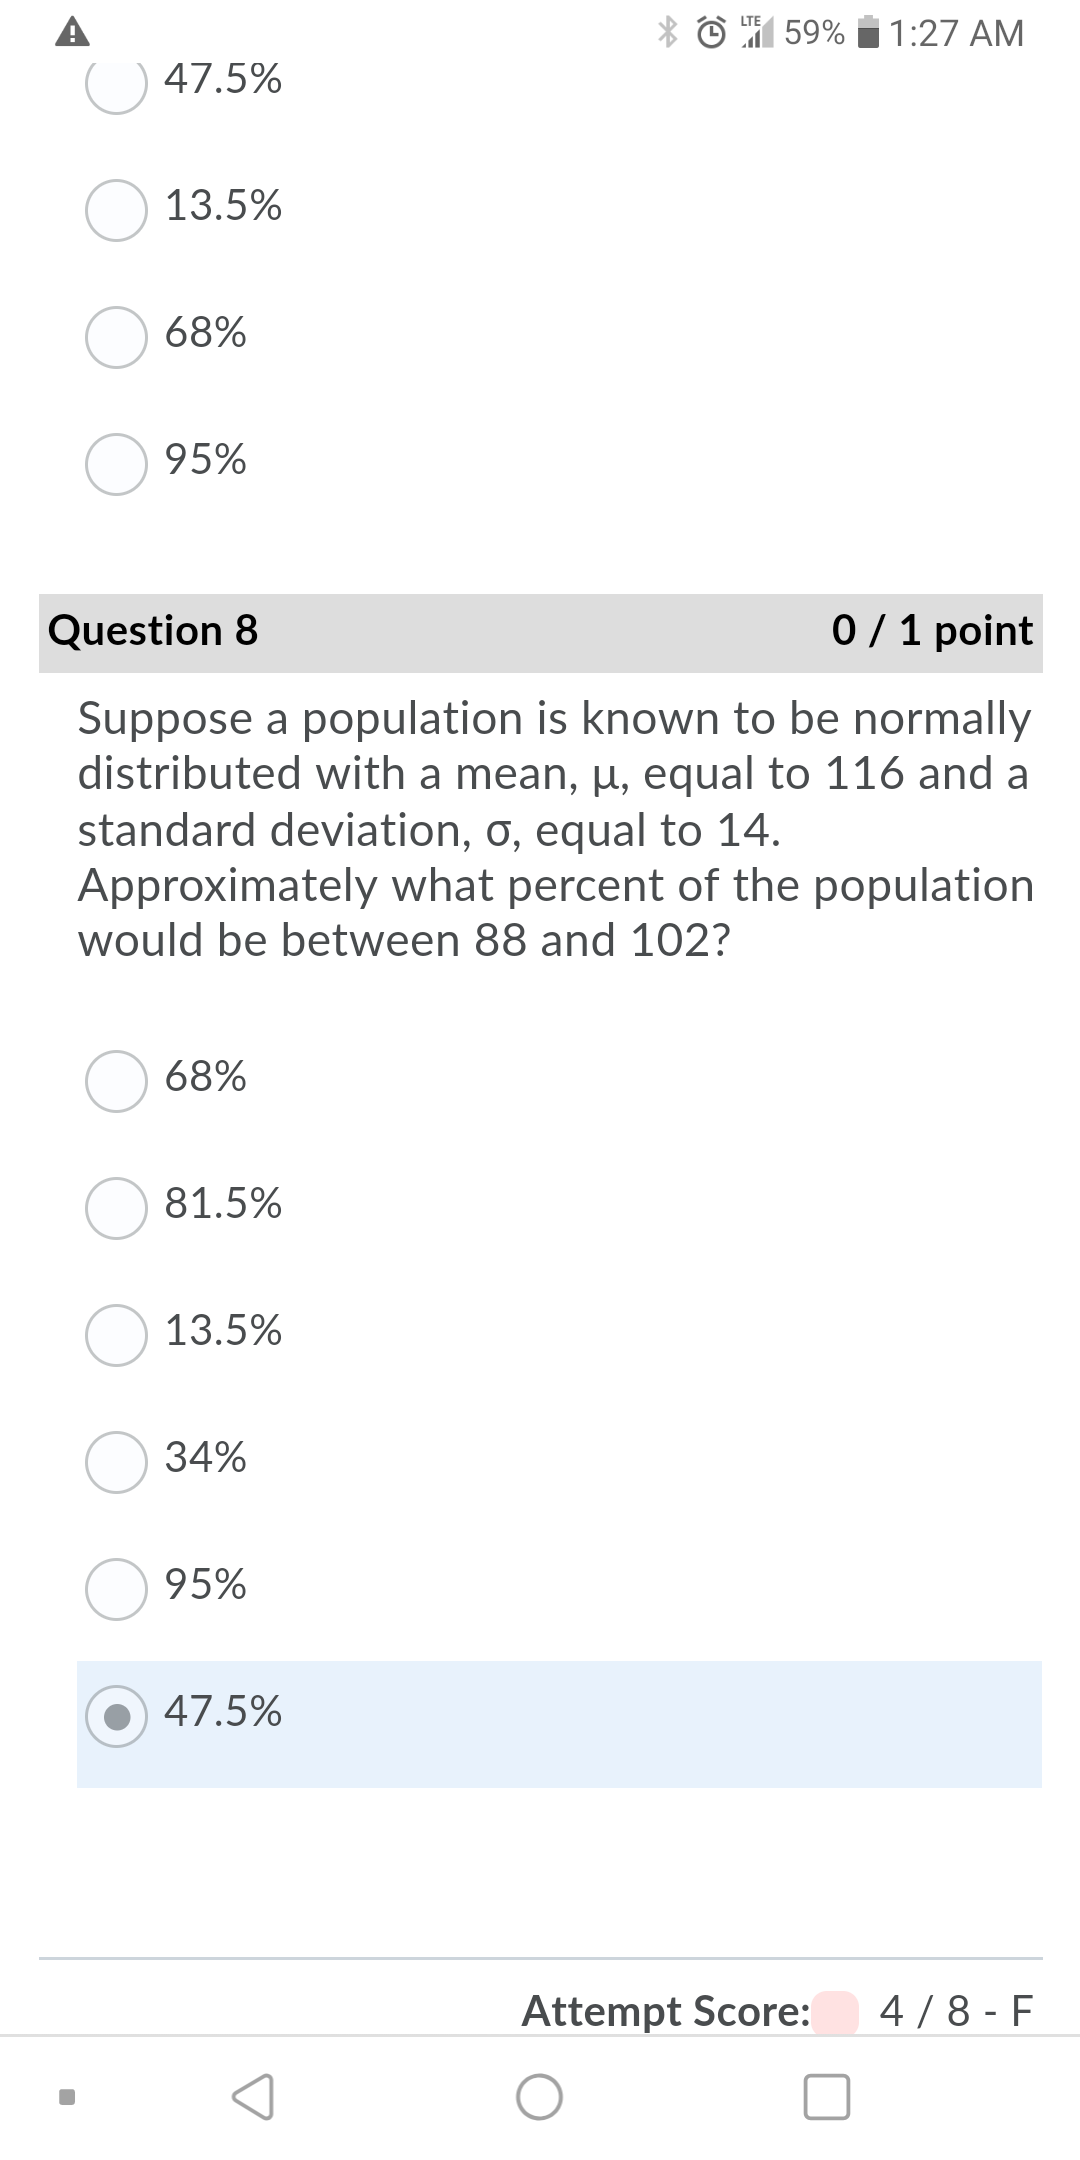
Transcribed Image Text:I 59%
1:27 AM
47.5%
13.5%
68%
95%
Question 8
0 / 1 point
Suppose a population is known to be normally
distributed with a mean, u, equal to 116 and a
standard deviation, o, equal to 14.
Approximately what percent of the population
would be between 88 and 102?
68%
81.5%
13.5%
34%
95%
47.5%
Attempt Score:
4 / 8 - F
Expert Solution
This question has been solved!
Explore an expertly crafted, step-by-step solution for a thorough understanding of key concepts.
This is a popular solution
Trending nowThis is a popular solution!
Step by stepSolved in 2 steps with 2 images

Knowledge Booster
Similar questions
- Assume that a randomly selected subject is given a bone density test. Bone density test scores are normally distributed with a mean of 0 and a standard deviation of 1. Draw a graph and find P, the 11th percentile. This is the bone density score separating the bottom 11% from the top 89%. Which graph represents P ? Choose the correct graph below. O A. O B. OD. P11 P11 P11 P11 The bone density score corresponding to P1 is (Round to two decimal places as needed.) Click to select your answer(s). APR tv MacBook Air F9 F10 LLA 20 F3 F6 F8 F4 F5 F1 F2 & #3 7 8. %24arrow_forward#4arrow_forwardUse the following frequency distribution table to find the value of the mean score. Scores Frequency1 - 3 54 - 6 17 - 9 3 Find the value of the standard deviation. Give your answer accurate to 1 place after the decimal point. σ =arrow_forward
- Answer part Carrow_forwardYou have a normal population with a mean of 1000 and a standard deviation of 100.Determine the scores associated with the following percentiles: 50% 45% 95% 5% 77%arrow_forwardCalcium levels in people are normally distributed with a mean of 9.7 mgdL and a standard deviation of 0.5 mgdL . Individuals with calcium levels in the bottom 10% of the population are considered to have low calcium levels. Find the calcium level that is the borderline between low calcium levels and those not considered low. Carry your intermediate computations to at least four decimal places. Round your answer to one decimal place.arrow_forward
- A normally distributed data set has a mean of 100 and a standard deviation of 5. What percent of data values are bigger than 105 ? 16 % 95% 60 % 32 %arrow_forwardM1a6 chapter 3 9arrow_forwardUse the table to answer the question. Note: Round z-scores to the nearest hundredth and then find the required A values using the table.A manufacturer of light bulbs finds that one light bulb model has a mean life span of 1028 h with a standard deviation of 87 h. What percent of these light bulbs will last as follows? (Round your answers to one decimal place.) (a) at least 980 h %(b) between 840 and 890 h %arrow_forward
- Question 13 The time to complete an exam is approximately Normal with a mean of 43 minutes and a standard deviation of 5 minutes. The bell curve below represents the distribution for testing times. The scale on the horizontal axis is equal to the standard deviation. Fill in the indicated boxes. H = 43 o = 5 H-30 u-20 u+ 20 u+ 30 00 Question Help: e Written Example Message instructor Submit Question Jump to Answerarrow_forwardA population has a mean of 1398.25 and standard deviation of 246.85 14 The middle interval that captures 95% of the means from samples of size 68 is, a 1351.04 1445.46 b 1348.03 1448.47 c 1344.82 1451.68 d 1341.41 1455.09arrow_forwardPart a: find the standard deviation and round answer to at least one decimal place part b: find the range rule of thumb and round the answer to one decimal placearrow_forward
arrow_back_ios
arrow_forward_ios
Recommended textbooks for you
 MATLAB: An Introduction with ApplicationsStatisticsISBN:9781119256830Author:Amos GilatPublisher:John Wiley & Sons Inc
 Probability and Statistics for Engineering and th...StatisticsISBN:9781305251809Author:Jay L. DevorePublisher:Cengage Learning
 Statistics for The Behavioral Sciences (MindTap C...StatisticsISBN:9781305504912Author:Frederick J Gravetter, Larry B. WallnauPublisher:Cengage Learning
 Elementary Statistics: Picturing the World (7th E...StatisticsISBN:9780134683416Author:Ron Larson, Betsy FarberPublisher:PEARSON
 The Basic Practice of StatisticsStatisticsISBN:9781319042578Author:David S. Moore, William I. Notz, Michael A. FlignerPublisher:W. H. Freeman
 Introduction to the Practice of StatisticsStatisticsISBN:9781319013387Author:David S. Moore, George P. McCabe, Bruce A. CraigPublisher:W. H. Freeman

MATLAB: An Introduction with Applications
Statistics
ISBN:9781119256830
Author:Amos Gilat
Publisher:John Wiley & Sons Inc

Probability and Statistics for Engineering and th...
Statistics
ISBN:9781305251809
Author:Jay L. Devore
Publisher:Cengage Learning

Statistics for The Behavioral Sciences (MindTap C...
Statistics
ISBN:9781305504912
Author:Frederick J Gravetter, Larry B. Wallnau
Publisher:Cengage Learning

Elementary Statistics: Picturing the World (7th E...
Statistics
ISBN:9780134683416
Author:Ron Larson, Betsy Farber
Publisher:PEARSON

The Basic Practice of Statistics
Statistics
ISBN:9781319042578
Author:David S. Moore, William I. Notz, Michael A. Fligner
Publisher:W. H. Freeman

Introduction to the Practice of Statistics
Statistics
ISBN:9781319013387
Author:David S. Moore, George P. McCabe, Bruce A. Craig
Publisher:W. H. Freeman