
MATLAB: An Introduction with Applications
6th Edition
ISBN: 9781119256830
Author: Amos Gilat
Publisher: John Wiley & Sons Inc
expand_more
expand_more
format_list_bulleted
Related questions
Question
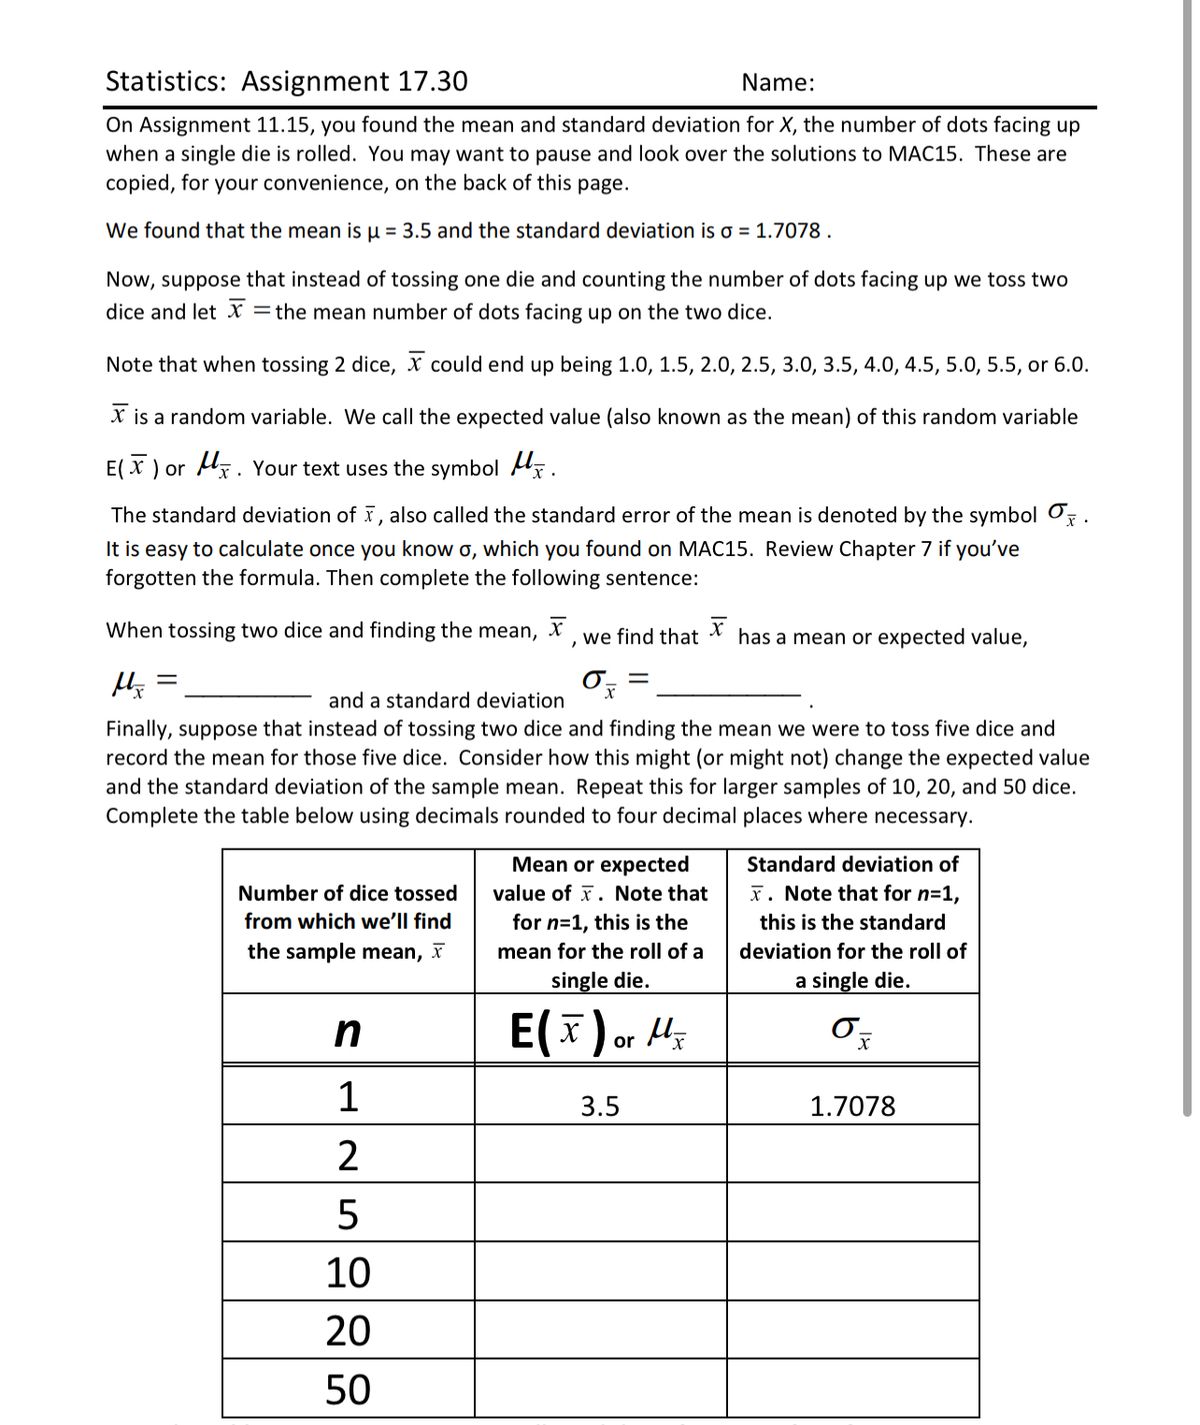

Transcribed Image Text:**Statistics: Assignment 17.30**
**Dice Roll Analysis**
**Background:**
In Assignment 11.15, we evaluated the mean and standard deviation for \( X \), which represents the number of dots facing up when a single die is rolled. Here, the mean calculated was \( \mu = 3.5 \) and the standard deviation was \( \sigma = 1.7078 \).
**Scenario:**
Now, consider tossing two dice and calculating the mean number of dots facing up. Let \( \overline{X} \) be the mean number of dots facing up on the two dice. For two dice, \( \overline{X} \) could range from 1.0 to 6.0 in increments of 0.5 (e.g., 1.0, 1.5, ..., 6.0).
**Random Variables:**
The expected value, or mean, of this random variable \( \overline{X} \) is denoted by \( E(\overline{X}) \) or \( \mu_{\overline{X}} \).
**Standard Deviation:**
The standard deviation of \( \overline{X} \), also known as the standard error of the mean, is denoted by \( \sigma_{\overline{X}} \). This is calculated easily if you know \( \sigma \).
**Exercises:**
Complete the sentence:
- When tossing two dice and finding the mean, \( \overline{X} \), the mean or expected value \( \mu_{\overline{X}} = \) ________ and a standard deviation \( \sigma_{\overline{X}} = \) ________.
Next, consider tossing five dice and finding the mean, and how it affects the expected value and standard deviation. Repeat this for samples of 10, 20, and 50 dice.
**Table Completion:**
| Number of dice tossed from which we’ll find the sample mean, \( \overline{X} \) \( (n) \) | Mean or expected value of \( \overline{X} \) \( E(\overline{X}) \) or \( \mu_{\overline{X}} \) | Standard deviation of \( \overline{X} \) \( \sigma_{\overline{X}} \) |
|---|---|---|
| 1 | 3.5
Expert Solution
This question has been solved!
Explore an expertly crafted, step-by-step solution for a thorough understanding of key concepts.

This is a popular solution

Trending nowThis is a popular solution!

Step by stepSolved in 2 steps

Knowledge Booster

Similar questions
- Note:-arrow_forwardIt showed incorrectarrow_forwardPlease tell the steps to solve this problem using Ti-84 Calculator. Testing:H0:μ=25.9H1:μ<25.9Your sample consists of 38 subjects, with a mean of 25.3 and standard deviation of 1.41.Calculate the test statistic, rounded to 2 decimal places.arrow_forward
- A recent study evaluated how addicted teenagers become to nicotine once they start smoking. The response variable was the number of yes answers on a questionnaire called the Hooked on Nicotine Checklist (HONC). Of teenagers who had tried tobacco, the mean HONC score was 3.8 (s = 4.4) for the 141 females and 2.4 (s = 3.5) for the 178 males. Complete parts a through c below. a. Find the standard error comparing the sample means. Interpret. The standard error is se= 0.4540. (Round to four decimal places as needed.) What does the standard error indicate? ... OA. The standard error is the standard deviation of the sample for this study. OCT 28 OB. The standard error is the difference in standard deviations for the two populations. OC. The standard error is the standard deviation of the difference between x₁-x₂. D. The standard error describes the spread of the sampling distribution of x₁-x₂. b. Find the test statistic and P-value for Ho: H₁ H₂ and Ha: H₁ H₂. Interpret, and explain what (if…arrow_forwardcomplete the following details pleasearrow_forwardPlease answer part (a) and part (b)arrow_forward
- Please helparrow_forwardI need the shade of the part of the curve corresponding to the calculation on both. On #1 and #2 since it was given thru this app when I submitted it. Thank youarrow_forwardgiven the following histogram what of the following could be tru ? (Coulf be multiple) Given those outliers, this one may not ever get to normalNothing seems odd with this number of points.• Looks like it could be bimodalLooks like it's normalData has outliers* Data offset significantly from customer's desired range of 20-21 #/reamarrow_forward
- I need help and directions on how to solve the two subparts of this question on TI84 calculator. Thank you. The average fruit fly will lay 424 eggs into rotting fruit. A biologist wants to see if the average will change for flies that have a certain gene modified. The data below shows the number of eggs that were laid into rotting fruit by several fruit flies that had this gene modified. Assume that the distribution of the population is normal. 426, 445, 417, 410, 415, 418, 412, 439, 452, 447, 407, 423, 447, 441 What can be concluded at the the alpha = 0.10 level of significance level of significance? The p-value = (Please show your answer to 4 decimal places.) Based on this, we should__________the null hypothesis.arrow_forwardAssume that the readings on the thermometers are normally distributed with a mean of 0° and standard deviation of 1.00°C. A thermometer is randomly selected and tested. Draw a sketch and find the temperature reading corresponding to P34, the 84th percentile. This is the temperature reading separating the bottom 84% from the top 16%. Click to view page 1 of the table. Click to view page 2 of the table. Which graph represents P ? Choose the correct graph below. 84 A. В. OC. D. Ay X The temperature for P84 is approximately (Round to two decimal places as needed.)arrow_forwardI'm not sure where is my mistake solving this problem. I have revised my calculation three times already and I'm not sure if the step to solve it is wrong or if it is my rounding the problem. Thank you for your helparrow_forward
arrow_back_ios
arrow_forward_ios
Recommended textbooks for you
- MATLAB: An Introduction with ApplicationsStatisticsISBN:9781119256830Author:Amos GilatPublisher:John Wiley & Sons Inc
 Probability and Statistics for Engineering and th...StatisticsISBN:9781305251809Author:Jay L. DevorePublisher:Cengage Learning
 Statistics for The Behavioral Sciences (MindTap C...StatisticsISBN:9781305504912Author:Frederick J Gravetter, Larry B. WallnauPublisher:Cengage Learning
  Elementary Statistics: Picturing the World (7th E...StatisticsISBN:9780134683416Author:Ron Larson, Betsy FarberPublisher:PEARSON
 The Basic Practice of StatisticsStatisticsISBN:9781319042578Author:David S. Moore, William I. Notz, Michael A. FlignerPublisher:W. H. Freeman
 Introduction to the Practice of StatisticsStatisticsISBN:9781319013387Author:David S. Moore, George P. McCabe, Bruce A. CraigPublisher:W. H. Freeman
MATLAB: An Introduction with Applications
Statistics
ISBN:9781119256830
Author:Amos Gilat
Publisher:John Wiley & Sons Inc
Probability and Statistics for Engineering and th...
Statistics
ISBN:9781305251809
Author:Jay L. Devore
Publisher:Cengage Learning
Statistics for The Behavioral Sciences (MindTap C...
Statistics
ISBN:9781305504912
Author:Frederick J Gravetter, Larry B. Wallnau
Publisher:Cengage Learning
Elementary Statistics: Picturing the World (7th E...
Statistics
ISBN:9780134683416
Author:Ron Larson, Betsy Farber
Publisher:PEARSON
The Basic Practice of Statistics
Statistics
ISBN:9781319042578
Author:David S. Moore, William I. Notz, Michael A. Fligner
Publisher:W. H. Freeman
Introduction to the Practice of Statistics
Statistics
ISBN:9781319013387
Author:David S. Moore, George P. McCabe, Bruce A. Craig
Publisher:W. H. Freeman