
MATLAB: An Introduction with Applications
6th Edition
ISBN: 9781119256830
Author: Amos Gilat
Publisher: John Wiley & Sons Inc
expand_more
expand_more
format_list_bulleted
Related questions
Question
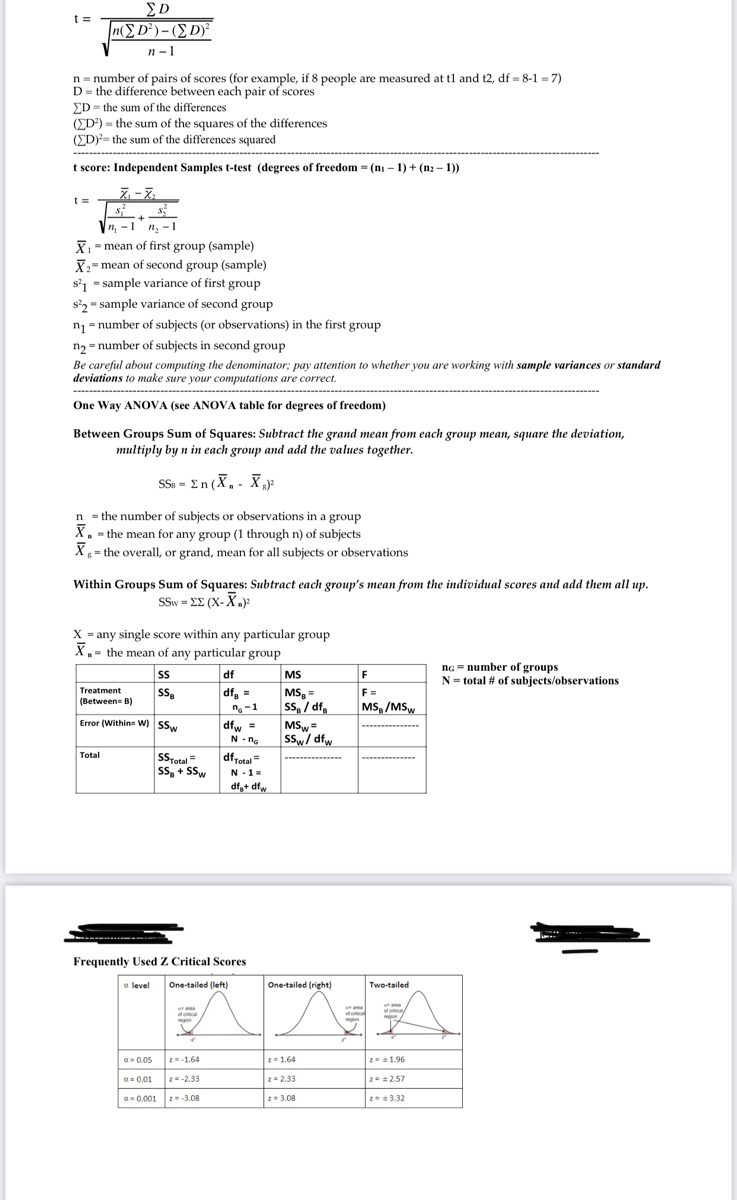

Transcribed Image Text:t =
n(E D)- (E D)
n -1
n = number of pairs of scores (for example, if 8 people are measured at tl and t2, df = 8-1 = 7)
D= the difference between each pair of scores
ED = the sum of the differences
(ED") = the sum of the squares of the differences
(ED)= the sum of the differences squared
t score: Independent Samples t-test (degrees of freedom = (ni – 1) + (n2 – 1))
Z. - Z.
+
Vn, -1'n, - 1
X - mean of first group (sample)
X:- mean of second group (sample)
s21 = sample variance of first group
s?, = sample variance of second group
n1 =number of subjects (or observations) in the first group
n, = number of subjects in second group
2=r
Be careful about computing the denominator; pay attention to whether you are working with sample variances or standard
deviations to make sure your computations are correct.
One Way ANOVA (see ANOVA table for degrees of freedom)
Between Groups Sum of Squares: Subtract the grand mean from each group mean, square the deviation,
multiply by n in each group and add the values together.
SSu = En (X,- X
n = the number of subjects or observations in a group
X, - the mean for any group (1 through n) of subjects
X = the overall, or grand, mean for all subjects or observations
Within Groups Sum of Squares: Subtract each group's mean from the individual scores and add them all up.
SSw - EE (X-X.j
X = any single score within any particular group
X,- the mean of any particular group
nG = number of groups
N= total # of subjects/observations
df
MS
F
Treatment
(Between= B)
SS.
df, =
MS, =
ss, / df,
MS=
SSw/ dfw
F =
MS, /MSw
n-1
dfw =
N - ng
Error (Within W) SS
Total
SStotal =
ss, + SSw
dfrotal =
3D
N -1 =
df,+ dfy
Frequently Used Z Critical Scores
a level
One-tailed (left)
Two-tailed
One-tailed (right)
a 0.05
2-1.64
21.64
21.96
a= 0.01
2=-2.33
z= 2.33
2= 2.57
a= 0.001 2=-3.08
z3.08
23.32

Transcribed Image Text:Hypothesis Testing
1. Harris (2020) tested levels of well-being in subjects with chronic anxiety undergoing brief therapy with mild
psychedelics three months before and again three months after the administration of a single session of therapy. The well-
being scores for the 16 subjects are listed in the “Before" and “After" columns in the Table below:
Well-Being Scores
Subject
Before
After
A
125
133
B
96
126
115
115
108
119
93
124
F
98
109
G
95
72
H
120
104
107
113
126
118
K
102
121
L
116
115
M
80
94
105
87
123
121
110
118
Use the data provided in the table to test whether well-being changed significantly from immediately before to 3 months
after the session. Set alpha at .05.
a) Write a null and alternative hypothesis
b) Determine the critical value and draw the comparison distribution with the rejection region(s) indicated
c) Compute the relevant statistic
d) Make a statistical decision (regarding the null hypothesis)
e) Write a conclusion based on the specific research question
Expert Solution
This question has been solved!
Explore an expertly crafted, step-by-step solution for a thorough understanding of key concepts.

This is a popular solution

Trending nowThis is a popular solution!

Step by stepSolved in 2 steps with 1 images

Knowledge Booster

Similar questions
- Short answer. You are conducting a study on an effective therapy for borderline personality disorder (BPD). Your subjects are randomly assigned to one of three types of therapy: 20 sessions of CBT, 20 sessions of DBT, and 20 sessions of psychoanalysis. Participants are given the Diagnostic Interview for Borderlines-Revised (DIB-R) before and after the 20 therapy sessions, to assess treatment efficacy. Based on the literature around BPD, you hypothesize that the DBT group will see the greatest improvement in DIB-R scores. 1) What measure of central tendency should you use to assess the dependent variable? And what is a potential confounding variable in this case? 2) What is your null hypothesis? What is your alternative hypothesis? 3) Is it directional or non-directional? and what statistical test would you use to assess your data? Please Answer Questions Completely Do Not Leave Questions Unsolvedarrow_forwardA researcher is interested in examining the relationship between ACT scores and college GPA. Participant ACT ?̅ = 29.67; ?? = 3.39 GPA ?̅ = 3.30; ?? = .52 1 24 2.75 2 28 3.25 3 29 3.50 4 35 3.75 5 34 4.00 6 30 3.80 7 29 2.60 8 27 2.68 9 31 3.36 Predict the GPA from an ACT score of 22. Predict the GPA from an ACT score of 25. Find the standard error of the estimate. What does this tell you about your predictions?arrow_forwardANOVA. Dr. Milgramm is conducting a patient satisfaction survey, rating how well her patients like her on a scale of 1-10. Her patients tend to fall into three categories: “Like a lot”, “like somewhat”, and “dislike a lot”. She believes that she might get different satisfaction scores from people in each group, but (because she's not great at numbers) she wants you to do an ANOVA to be sure. She has collected data from 12 patients (three equal groups) with the following results. Group 1) “Like a lot” Mean: 8 SS: 2 N: df: Group 2) “Like somewhat” Mean: 5 SS: 6 N: df: Group 3) “Dislike a lot” Mean: 2 SS: 4 N: df: Grand Mean: df Within-Group:__________ df Between-Groups:___________ Estimated Variance (S21) for Group 1: _______ Estimated Variance (S22) for Group 2: ___________ Estimated…arrow_forward
- A researcher is interested in investigating the relationship between sugar consumption and weight gain for high school students. 15 volunteers were randomly assigned to one of two groups. The first group contained 6 volunteers who were put on a low sugar diet. The second group consisting of the remaining 9 volunteers was put on a diet with sugar constituting approximately 15% of their diet. After 8 weeks, the change in weight was recorded for each of the volunteers. Question: What is the response variable? What study principle was used in this study and what kind of study is this?arrow_forwardYou are interested in investigating the efficacy of a new pain medication and design an experiment measuring pain levels before and after the administration of a new medication. You recruit 9 people to participate in your study and bring the same 9 participants in for two separate sessions. Here is the raw data: Pair Number Placebo Pain Score Pain Medication Pain Score 1 2 4 5 6 7 8 9 5 7 10 5 8 7 8 6 8 QUESTION 20 5 5 8 4 4 3 5 3 2 Use the t-test handout printout provided to calculate the t- statistic. What is the t-test statistic value? Round to the nearest tenth. What conclusion would you make on the above data, based on the t-value you calculated and the critical value of t? O You accept the null hypothesis because the t-value you calculated is inside the bounds of the critical t-value O You reject the null hypothesis because the t-value you calculated is inside the bounds of the critical t-value O You reject the null hypothesis because the t-value you calculated is outside the…arrow_forwardJohnson and Leone describe an experiment to investigate the warping of copper plates. The two factors studied were temperature and the copper content of the plates. The response variable was a measure of the amount of warping. The data are as follows: Temperature (°C) 50 75 100 Copper Content (%) 40 60 80 100 17 20 12 9 16 12 21 17 21 16 24 21 18 13 18 21 ZZFEHERRE 23 22 27 17 27 31 30 23 29 31 12 25 23 23 28 22 125 Source: Applied Statistics and Probability for Engineers, 6th Edition, Douglas, C. Montgomery & George, C. Runger. 1. Draw and interpret the interaction plot. ii. Is there any significant interaction between the factors? Use a = 0.05. ii. Can your interpretation in (i) be validated in (ii)? Twelve plants are randomlyarrow_forward
arrow_back_ios
arrow_forward_ios
Recommended textbooks for you
- MATLAB: An Introduction with ApplicationsStatisticsISBN:9781119256830Author:Amos GilatPublisher:John Wiley & Sons Inc
 Probability and Statistics for Engineering and th...StatisticsISBN:9781305251809Author:Jay L. DevorePublisher:Cengage Learning
 Statistics for The Behavioral Sciences (MindTap C...StatisticsISBN:9781305504912Author:Frederick J Gravetter, Larry B. WallnauPublisher:Cengage Learning
  Elementary Statistics: Picturing the World (7th E...StatisticsISBN:9780134683416Author:Ron Larson, Betsy FarberPublisher:PEARSON
 The Basic Practice of StatisticsStatisticsISBN:9781319042578Author:David S. Moore, William I. Notz, Michael A. FlignerPublisher:W. H. Freeman
 Introduction to the Practice of StatisticsStatisticsISBN:9781319013387Author:David S. Moore, George P. McCabe, Bruce A. CraigPublisher:W. H. Freeman
MATLAB: An Introduction with Applications
Statistics
ISBN:9781119256830
Author:Amos Gilat
Publisher:John Wiley & Sons Inc
Probability and Statistics for Engineering and th...
Statistics
ISBN:9781305251809
Author:Jay L. Devore
Publisher:Cengage Learning
Statistics for The Behavioral Sciences (MindTap C...
Statistics
ISBN:9781305504912
Author:Frederick J Gravetter, Larry B. Wallnau
Publisher:Cengage Learning
Elementary Statistics: Picturing the World (7th E...
Statistics
ISBN:9780134683416
Author:Ron Larson, Betsy Farber
Publisher:PEARSON
The Basic Practice of Statistics
Statistics
ISBN:9781319042578
Author:David S. Moore, William I. Notz, Michael A. Fligner
Publisher:W. H. Freeman
Introduction to the Practice of Statistics
Statistics
ISBN:9781319013387
Author:David S. Moore, George P. McCabe, Bruce A. Craig
Publisher:W. H. Freeman