
MATLAB: An Introduction with Applications
6th Edition
ISBN: 9781119256830
Author: Amos Gilat
Publisher: John Wiley & Sons Inc
expand_more
expand_more
format_list_bulleted
Related questions
Question
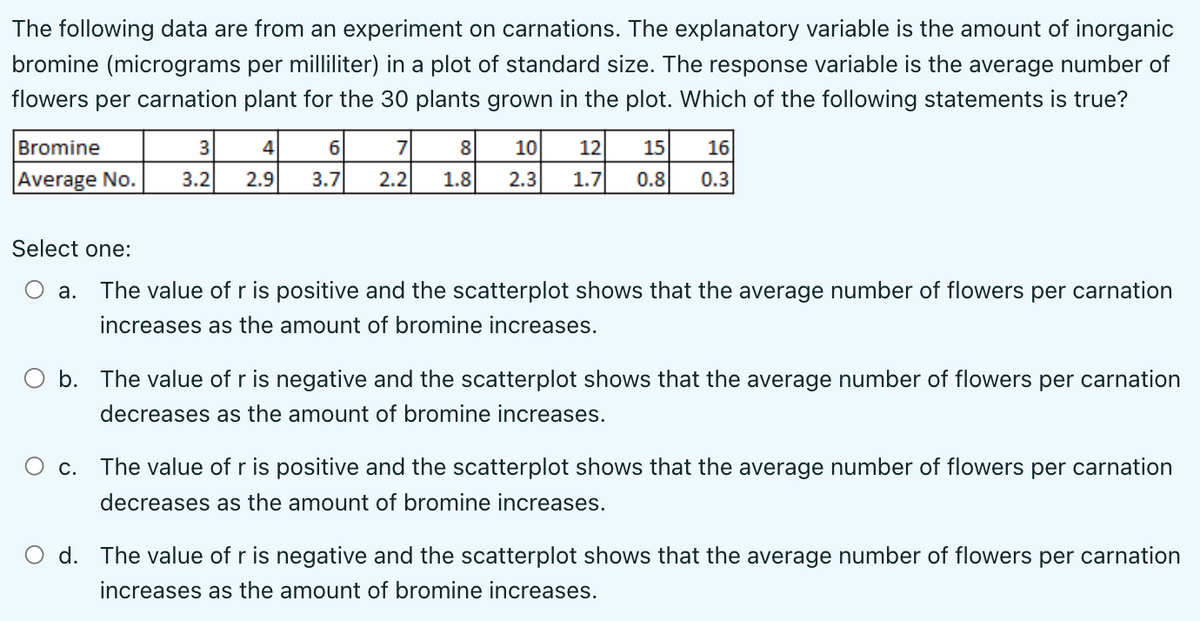

Transcribed Image Text:The following data are from an experiment on carnations. The explanatory variable is the amount of inorganic
bromine (micrograms per milliliter) in a plot of standard size. The response variable is the average number of
flowers per carnation plant for the 30 plants grown in the plot. Which of the following statements is true?
Bromine
Average No.
3 4
3.2 2.9
6
3.7
C.
7
2.2
8 10 12 15 16
1.8 2.3 1.7 0.8 0.3
Select one:
a. The value of r is positive and the scatterplot shows that the average number of flowers per carnation
increases as the amount of bromine increases.
b. The value of r is negative and the scatterplot shows that the average number of flowers per carnation
decreases as the amount of bromine increases.
The value of r is positive and the scatterplot shows that the average number of flowers per carnation
decreases as the amount of bromine increases.
d. The value of r is negative and the scatterplot shows that the average number of flowers per carnation
increases as the amount of bromine increases.
Expert Solution
This question has been solved!
Explore an expertly crafted, step-by-step solution for a thorough understanding of key concepts.

This is a popular solution

Trending nowThis is a popular solution!

Step by stepSolved in 3 steps with 3 images

Knowledge Booster

Similar questions
- You wish to determine if there is a positive linear correlation between the age of a driver and the number of driver deaths. The following table represents the age of a driver and the number of driver deaths per 100,000. Use a significance level of 0.05 and round all values to 4 decimal places. Driver Age Number of Driver Deaths per 100,000 60 35 55 23 22 32 40 36 40 18 38 33 80 28 37 25 Ho: ρ = 0Ha: ρ > 0 Find the Linear Correlation Coefficient r = ? Find the p-value p-value = The p-value is ? Greater than αα or Less than (or equal to) αarrow_forwardYou wish to determine if there is a negative linear correlation between the age of a driver and the number of driver deaths. The following table represents the age of a driver and the number of driver deaths per 100,000. Use a significance level of 0.05 and round all values to 4 decimal places. Driver Age Number of Driver Deaths per 100,000 48 27 38 32 57 23 43 22 43 32 38 36 72 19 Ho: ρ = 0Ha: ρ < 0 Find the Linear Correlation Coefficient r = Find the p-value p-value = The conclusion is There is a significant linear correlation between driver age and number of driver deaths. There is a significant negative linear correlation between driver age and number of driver deaths. There is insufficient evidence to make a conclusion about the linear correlation between driver age and number of driver deaths. There is a significant positive linear correlation between driver age and number of driver deaths.arrow_forward18. We want to study the relationship between size (sq. m) and the price of houses. We randomly chose 25 houses and recorded the size and price of them. The excel output for the data is given below: Regression statistics: Multiple R: 0.586378154 R Square: 0.343839339 Adjusted R Square: 0.315310615 Standard Error: 34761.73162 Observations: 25 df SS MS F SignificanceF Regression 1 14563843876 1.46E+10 12.05239 0.0020659 Residual 23 27792693660 1.21E+09 Total 24 42356537536 Coefficients StandardError T stat P-value lower95% upper95% Lower95.0% upper95.0% Intercept 189769.0334 28557.61831 6.645128 8.85E-07 130693.1 248844.968 130693.1 248844.968 Size (sq.meter) 444.1951525 127.9490924 3.471655 0.002066 179.51229 708.878016 179.51229 708.878016 Write down your answers to (a)-(c) in the box below. Give your answers to 4 decimal places. Write down 95% confidence interval for the slope of the relationship between price and size. We want to…arrow_forward
- Thomas wants to compare the mean concentration of carbon monoxide (CO) on residential versus commercial streets, since these differ in terms of car traffic. In each of three neighborhoods of Montréal (named A, B, and C below), he randomly chooses four locations for each type of street, for a total of 24 observations (2 street types x 3 neighborhoods x 4 locations). At each location, he measures CO concentration in the air over a period of 10 hours (8:00 AM-6:00 PM), and obtains the following data (in ppm/h). Question: Test whether or not the difference between residential and commercial streets in mean atmospheric CO concentration is the same among the three neighborhoods, and whether or not CO concentration in the air is the same, on average, for the two types of streets. Note that Neighborhood is considered a random block factor in the ANOVA. Use significant level= 0.05.arrow_forwardThe concentration level of Zinc in milligrams in two types of soil was found to be as follows Soil A: 2.1 4.0 6.3 5.4 4.8 3.7 6.1 3.3 Soil B: 0.6 3.1 2.5 4.0 6.2 1.6 2.2 1.9 5.4 To check the claim that the medians of concentration level in the two soils were unequal, we conducted an appropriate test at and we found that the test statistics is equal to a. 57 b. 65 c. 47 d. None Decision a. we reject the claim b. we fail to reject the claim c. we can’t decide d. Nonearrow_forwardThe following data are from an experiment on carnations. The explanatory variable is the amount of inorganic bromine (micrograms per milliliter) in a plot of standard size. The response variable is the average number of flowers per carnation plant for the 30 plants grown in the plot. Find the change in number of flowers per plant given an increase in 1 µg per mL of inorganic bromine. Amount of bromine Average no. of flowers Select one: O a. -0.216 O b. 0.216 O c. O d. -3.81 4.04 3 3.2 4 2.9 6 3.7 7 2.2 8 1.8 10 2.3 12 1.7 15 16 0.8 0.3arrow_forward
- Data was collected for a sample of organic snacks. The amount of sugar (in mg) in each snack is summarized in the histogram below. Frequency 14 12 10 n = 8 6 100 102 104 106 108 110 112 114 amount of sugar (mg) What is the sample size for this data set?arrow_forwardis my ans correctarrow_forwardNexium is a drug that can be used to reduce the acid produced by the body and heal damage to the esophagus. A researcher wants to estimate the proportion of patients taking Nexium that are healed within 8 weeks. A random sample of 224 patients suffering from acid reflux disease is obtained, and 213 of those patients were healed after 8 weeks. a. Identify the population of interest and sample of interest. what is the sample size? b. Describe the parameter of interest. c. Describe the statistic of interest. What value of the statistic obtained?arrow_forward
- Study A Use the following description of a research study to answer the next five questions. Researchers were were interested in promoting physical activity within the workplace. They recruited participants to join a team challenge encouraging ways to increase physical activity such as taking active breaks and taking the stairs. Participants either joined as a team or were assigned a team. These teams were then randomly assigned either to be the control group where they just received information about becoming more active or the team-building group, which received the same information as the control group but were encouraged to create a team name and bond as a team throughout the study. One outcome measure of the study was the number of flights of stairs that participants reported taking yesterday. Group Statistics Intervention Mean Std. Deviation Std. Error Mean Flights of stairs yesterday Cbntrol 18 2.3889 3.29240 77603 Team-building 16 6.0000 5.50151 1.37538 Lena Tes Equalty at…arrow_forwardThe following data comes from a study on the effects of sunlight on pea plants, where x = distance (in centimeters) from an ultraviolet light source and y = sunburn index. x 18 21 25 26 30 32 36 40 40 50 51 54 61 62 62 y 4.0 3.7 3.0 2.9 2.6 2.5 2.2 2.0 2.1 1.5 1.5 1.5 1.3 1.2 1.1 The Correlation Coefficient for this data is r = (3 decimals) Use three words to describe this correlation: , ,arrow_forwardSystolic coefficients of variation are 14.2% and the Diastolic is 17% The coefficients of variation for each data set are: a. more than 5 percentage points apart b. within 5 percentage points of each other Therefore, the systolic measurements vary a. about the same as b. significantly more than c. significantly less than the diastolic measurements.arrow_forward
arrow_back_ios
SEE MORE QUESTIONS
arrow_forward_ios
Recommended textbooks for you
- MATLAB: An Introduction with ApplicationsStatisticsISBN:9781119256830Author:Amos GilatPublisher:John Wiley & Sons Inc
 Probability and Statistics for Engineering and th...StatisticsISBN:9781305251809Author:Jay L. DevorePublisher:Cengage Learning
 Statistics for The Behavioral Sciences (MindTap C...StatisticsISBN:9781305504912Author:Frederick J Gravetter, Larry B. WallnauPublisher:Cengage Learning
  Elementary Statistics: Picturing the World (7th E...StatisticsISBN:9780134683416Author:Ron Larson, Betsy FarberPublisher:PEARSON
 The Basic Practice of StatisticsStatisticsISBN:9781319042578Author:David S. Moore, William I. Notz, Michael A. FlignerPublisher:W. H. Freeman
 Introduction to the Practice of StatisticsStatisticsISBN:9781319013387Author:David S. Moore, George P. McCabe, Bruce A. CraigPublisher:W. H. Freeman
MATLAB: An Introduction with Applications
Statistics
ISBN:9781119256830
Author:Amos Gilat
Publisher:John Wiley & Sons Inc
Probability and Statistics for Engineering and th...
Statistics
ISBN:9781305251809
Author:Jay L. Devore
Publisher:Cengage Learning
Statistics for The Behavioral Sciences (MindTap C...
Statistics
ISBN:9781305504912
Author:Frederick J Gravetter, Larry B. Wallnau
Publisher:Cengage Learning
Elementary Statistics: Picturing the World (7th E...
Statistics
ISBN:9780134683416
Author:Ron Larson, Betsy Farber
Publisher:PEARSON
The Basic Practice of Statistics
Statistics
ISBN:9781319042578
Author:David S. Moore, William I. Notz, Michael A. Fligner
Publisher:W. H. Freeman
Introduction to the Practice of Statistics
Statistics
ISBN:9781319013387
Author:David S. Moore, George P. McCabe, Bruce A. Craig
Publisher:W. H. Freeman