
MATLAB: An Introduction with Applications
6th Edition
ISBN: 9781119256830
Author: Amos Gilat
Publisher: John Wiley & Sons Inc
expand_more
expand_more
format_list_bulleted
Related questions
Question
What is the answer to part d
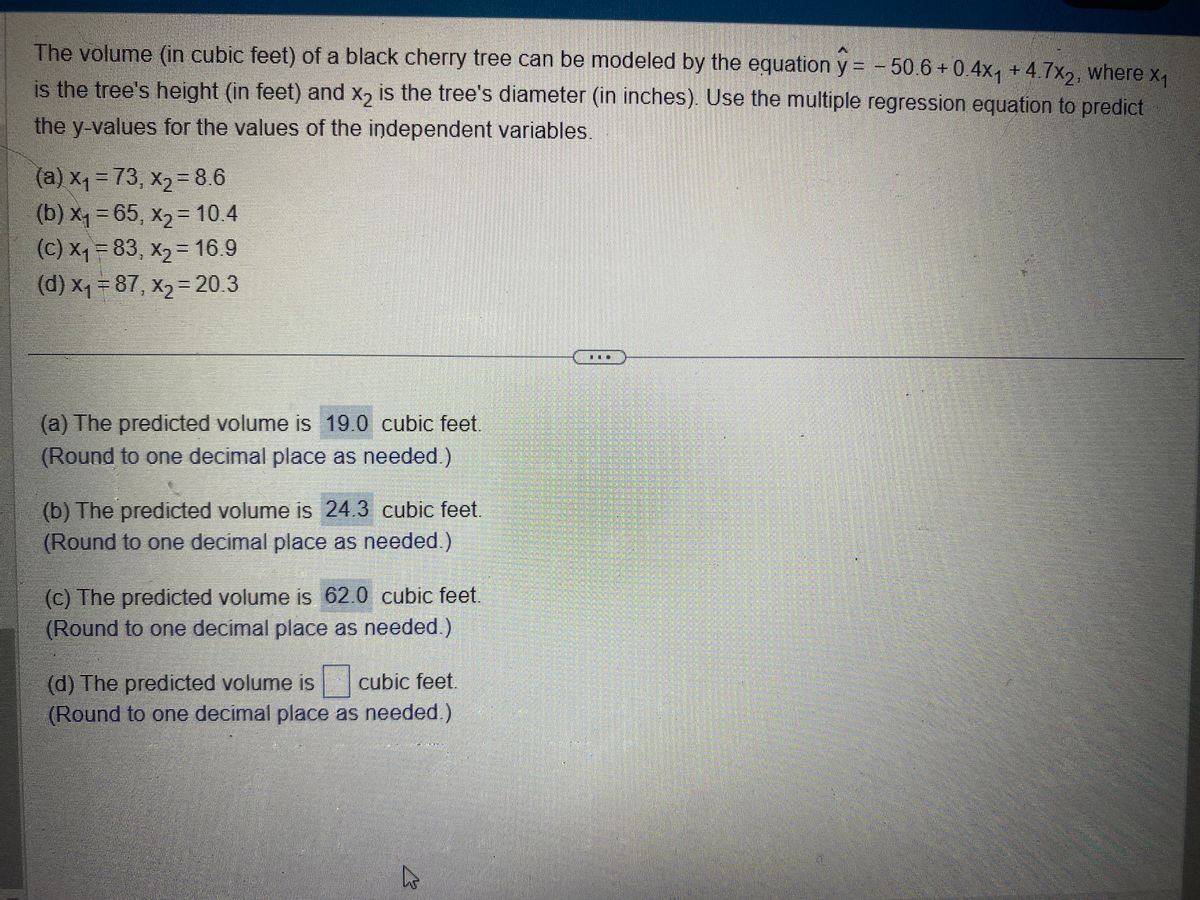

Transcribed Image Text:The volume (in cubic feet) of a black cherry tree can be modeled by the equation y = −50.6+0.4x₁ +4.7x2, where x₁
is the tree's height (in feet) and x2 is the tree's diameter (in inches). Use the multiple regression equation to predict
the y-values for the values of the independent variables.
(a) x₁ = 73, x₂ = 8.6
(b) x₁ = 65, x₂= 10.4
(c) x₁ = 83, x₂ = 16.9
(d) x₁ = 87, x₂ = 20.3
(a) The predicted volume is 19.0 cubic feet.
(Round to one decimal place as needed.)
(b) The predicted volume is 24.3 cubic feet.
(Round to one decimal place as needed.)
(c) The predicted volume is 62.0 cubic feet.
(Round to one decimal place as needed.)
(d) The predicted volume is cubic feet.
(Round to one decimal place as needed.)
k
20
Expert Solution
This question has been solved!
Explore an expertly crafted, step-by-step solution for a thorough understanding of key concepts.

Step by stepSolved in 3 steps with 2 images

Knowledge Booster

Similar questions
- A manufacturer of phone batteries determines that the average length of talk time for one of its batteries is 470 minutes. Suppose that the standard deviation is known to be 32 minutes and that the data are approximately bell-shaped. Estimate the percentage of batteries whose talk time is between 406 minutes and 534 minutes. Estimate the percentage of batteries whose talk time is less than 438 minutes. Estimate the percentage of batteries whose talk time is more than 534 minutes. answer in excelarrow_forwardCan you answer part c, d and e of the question?arrow_forwardAccording to the National Association of Colleges and Employers, the 2015 average starting salary for new college graduates in health sciences was $51,541. The average starting salary for new college graduates in business was $53,901 (National Association of Colleges and Employers website). Assume that starting salaries are normally distributed and that the standard deviation for starting salaries for new college graduates in health sciences is $11,000. Assume that the standard deviation for starting salaries for new college graduates in business is $15,000. a. What is the probability that a new college graduate in business will earn a starting salary of at least $65,000 (to 4 decimals)? b. What is the probability that a new college graduate in health sciences will earn a starting salary of at least $65,000 (to 4 decimals)? c. What is the probability that a new college graduate in health sciences will earn a starting salary less than $40,000 (to 4 decimals)? d. How much would a new…arrow_forward
arrow_back_ios
SEE MORE QUESTIONS
arrow_forward_ios
Recommended textbooks for you
- MATLAB: An Introduction with ApplicationsStatisticsISBN:9781119256830Author:Amos GilatPublisher:John Wiley & Sons Inc
 Probability and Statistics for Engineering and th...StatisticsISBN:9781305251809Author:Jay L. DevorePublisher:Cengage Learning
 Statistics for The Behavioral Sciences (MindTap C...StatisticsISBN:9781305504912Author:Frederick J Gravetter, Larry B. WallnauPublisher:Cengage Learning
  Elementary Statistics: Picturing the World (7th E...StatisticsISBN:9780134683416Author:Ron Larson, Betsy FarberPublisher:PEARSON
 The Basic Practice of StatisticsStatisticsISBN:9781319042578Author:David S. Moore, William I. Notz, Michael A. FlignerPublisher:W. H. Freeman
 Introduction to the Practice of StatisticsStatisticsISBN:9781319013387Author:David S. Moore, George P. McCabe, Bruce A. CraigPublisher:W. H. Freeman
MATLAB: An Introduction with Applications
Statistics
ISBN:9781119256830
Author:Amos Gilat
Publisher:John Wiley & Sons Inc
Probability and Statistics for Engineering and th...
Statistics
ISBN:9781305251809
Author:Jay L. Devore
Publisher:Cengage Learning
Statistics for The Behavioral Sciences (MindTap C...
Statistics
ISBN:9781305504912
Author:Frederick J Gravetter, Larry B. Wallnau
Publisher:Cengage Learning
Elementary Statistics: Picturing the World (7th E...
Statistics
ISBN:9780134683416
Author:Ron Larson, Betsy Farber
Publisher:PEARSON
The Basic Practice of Statistics
Statistics
ISBN:9781319042578
Author:David S. Moore, William I. Notz, Michael A. Fligner
Publisher:W. H. Freeman
Introduction to the Practice of Statistics
Statistics
ISBN:9781319013387
Author:David S. Moore, George P. McCabe, Bruce A. Craig
Publisher:W. H. Freeman